Bitcoin prices back in 2013 touched a high of $1,236 per BTC on December 4, and following that spike the price dropped for more than a year, all the way to $225 per coin on June 1, 2015. Last year in 2017 the price of BTC ran up higher, but this time reached $19,600 per coin, and it has lost considerable value since then. At the moment mainstream media (MSM) is reporting on how people who bought at the height in 2017 have lost quite a bit of their investment, but MSM has failed to report that this year’s dip is less, percentage wise, than the losses in 2013 and the extent of $19K to $6K loss has been far less severe.
Also read: Indian Women More Bullish On Crypto than Men, Invest Twice As Much
Despite MSM Headlines, Not Many People Purchased Cryptos at the ATH
Back in December of 2013, the cryptocurrency community saw its first big bull run as BTC market prices ran up to over $1,200 per coin. That means those who bought at the all-time-high (ATH) realized losses of around 81.7 percent on June 1, 2015, when the price tapped $225 per BTC. The 2013 bull run was much faster than 2017, and the ATH was short lived, as the run-up to $1,200 only took a couple months.

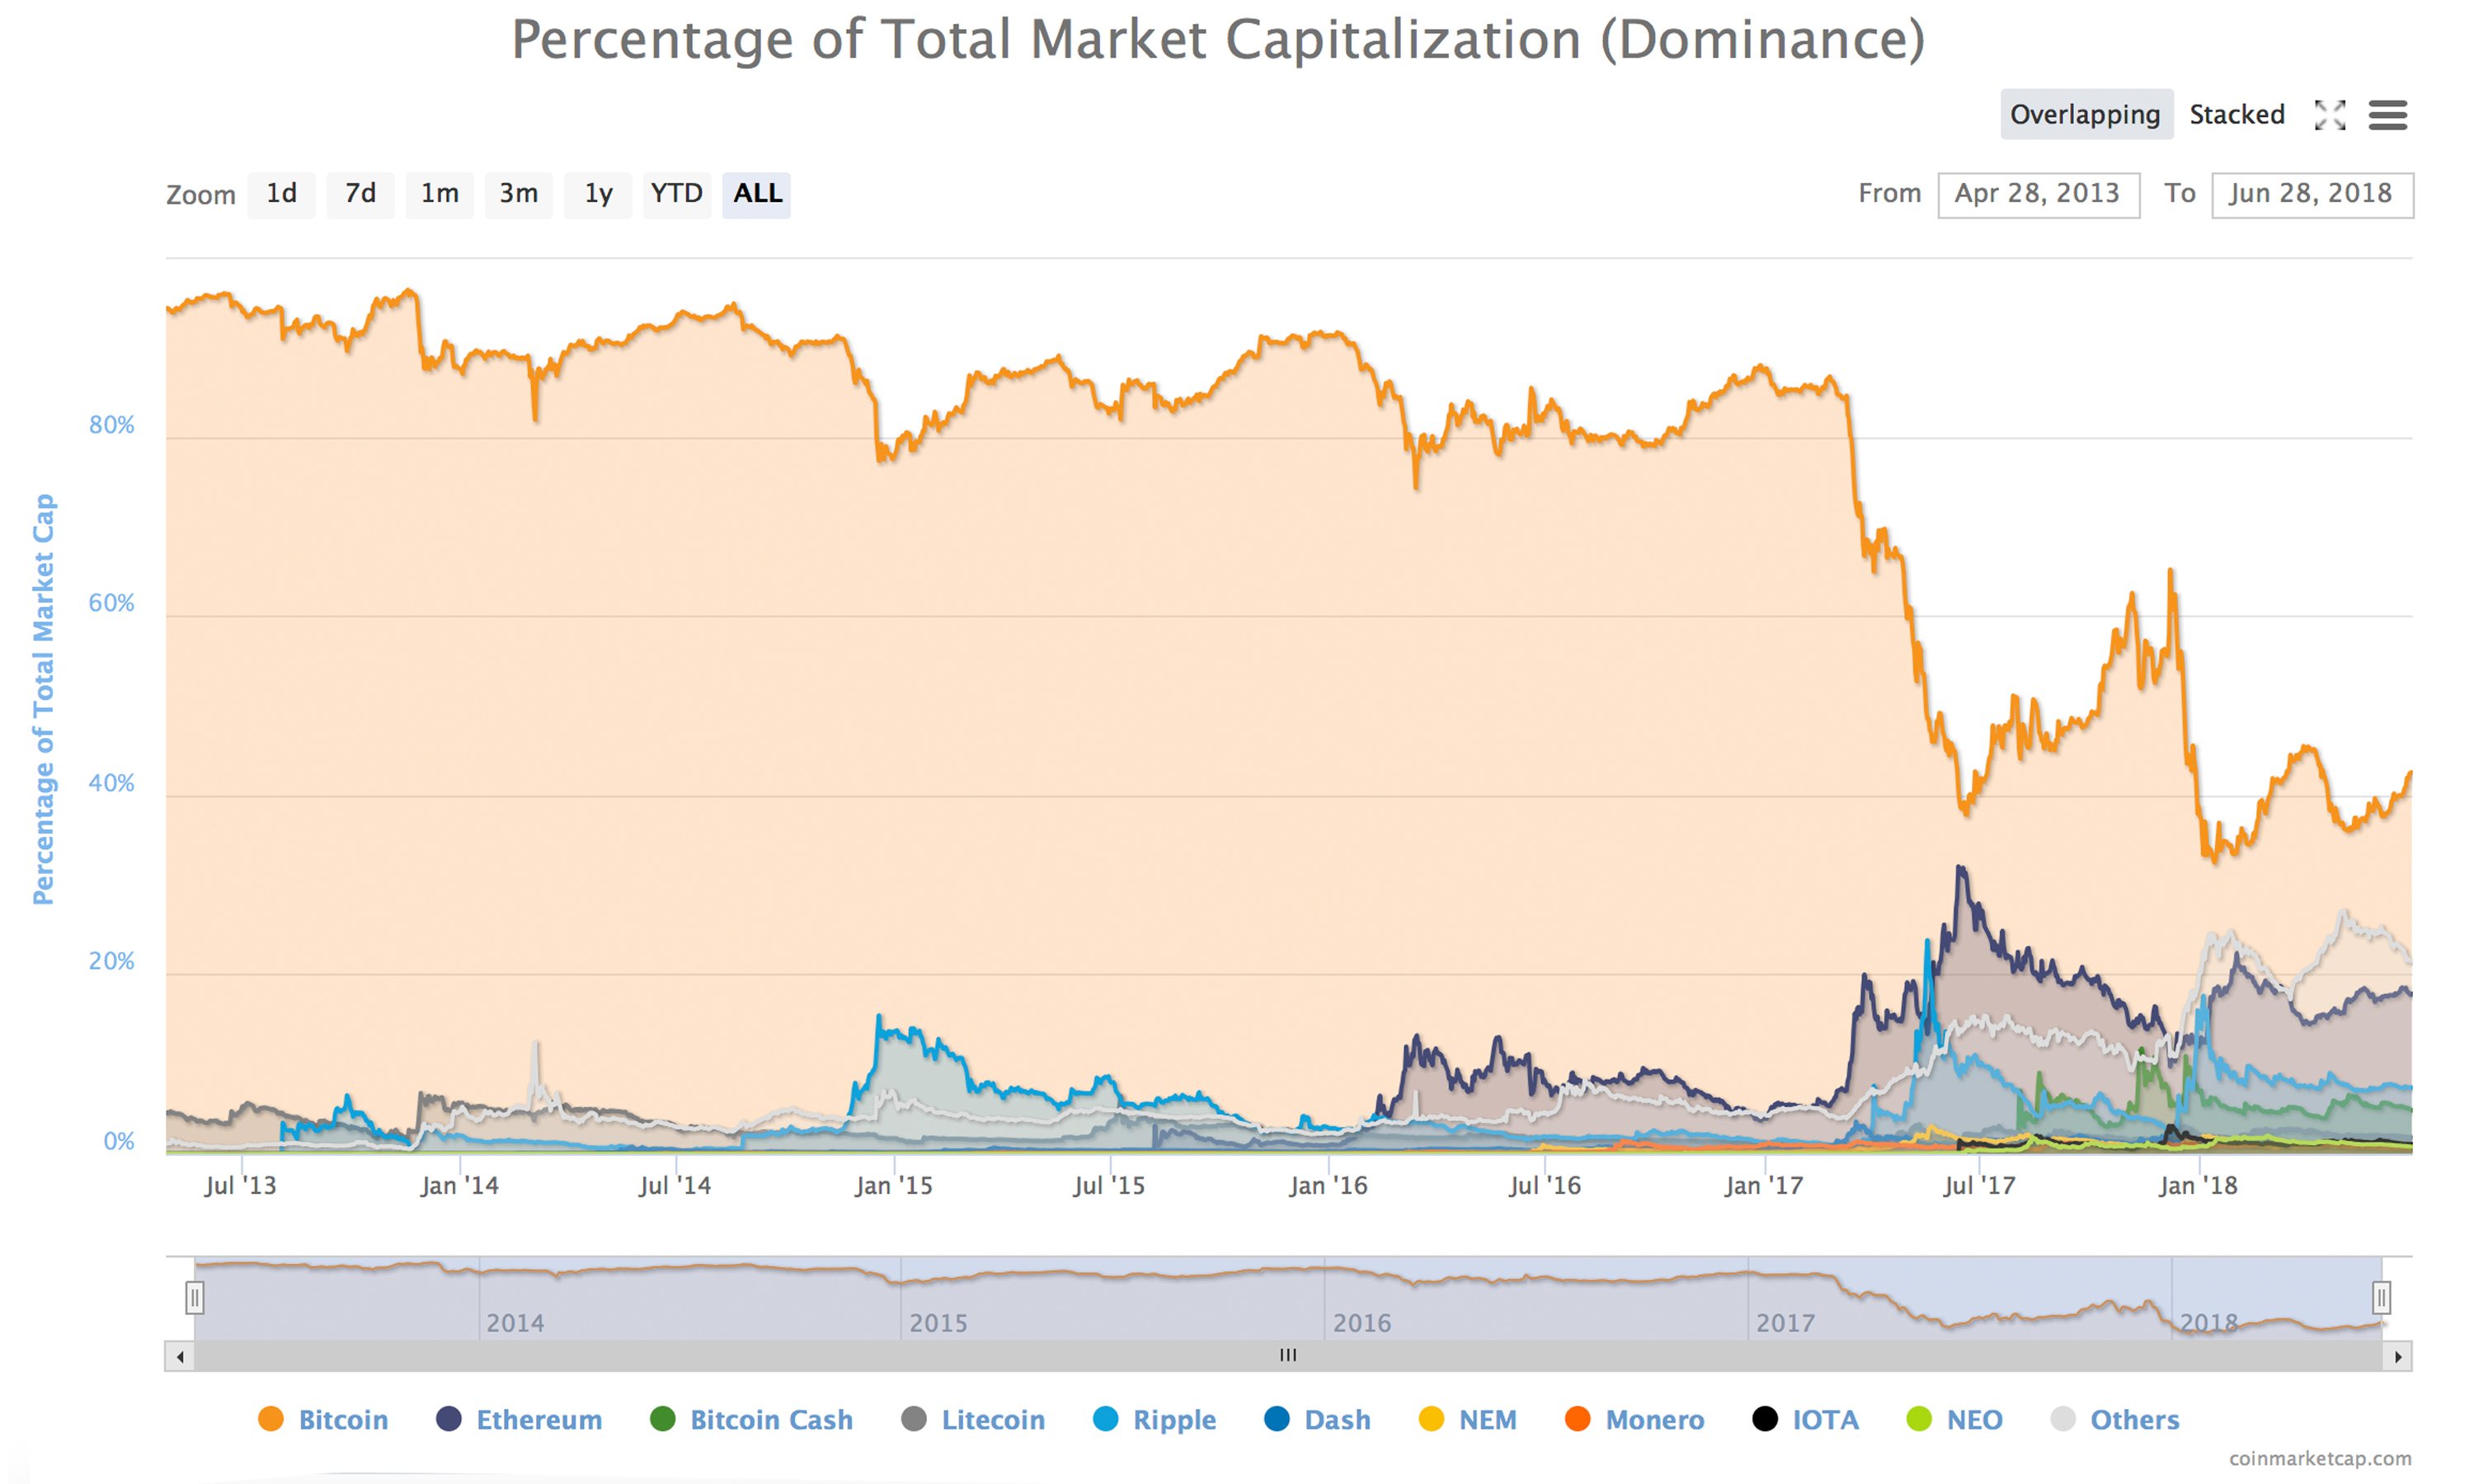
The 2017 bull run was all year long starting in December when the price of BTC surpassed 2013’s ATH. Additionally, at the same time, BTC dominance dropped from 90 percent in January 2017 to below 38 percent earlier this year. Currently, BTC dominance is around 42 percent but a big difference between 2013 and 2017 is the fact many other cryptocurrencies had their own ATHs. At the moment those who purchased BTC at the ATH are bearing a 69.3 percent loss at the time of publication.
People Who Bought BTC After October 15, 2017, Are In the Red Between 1-65% — Purchases Prior to This Date Still See Gains
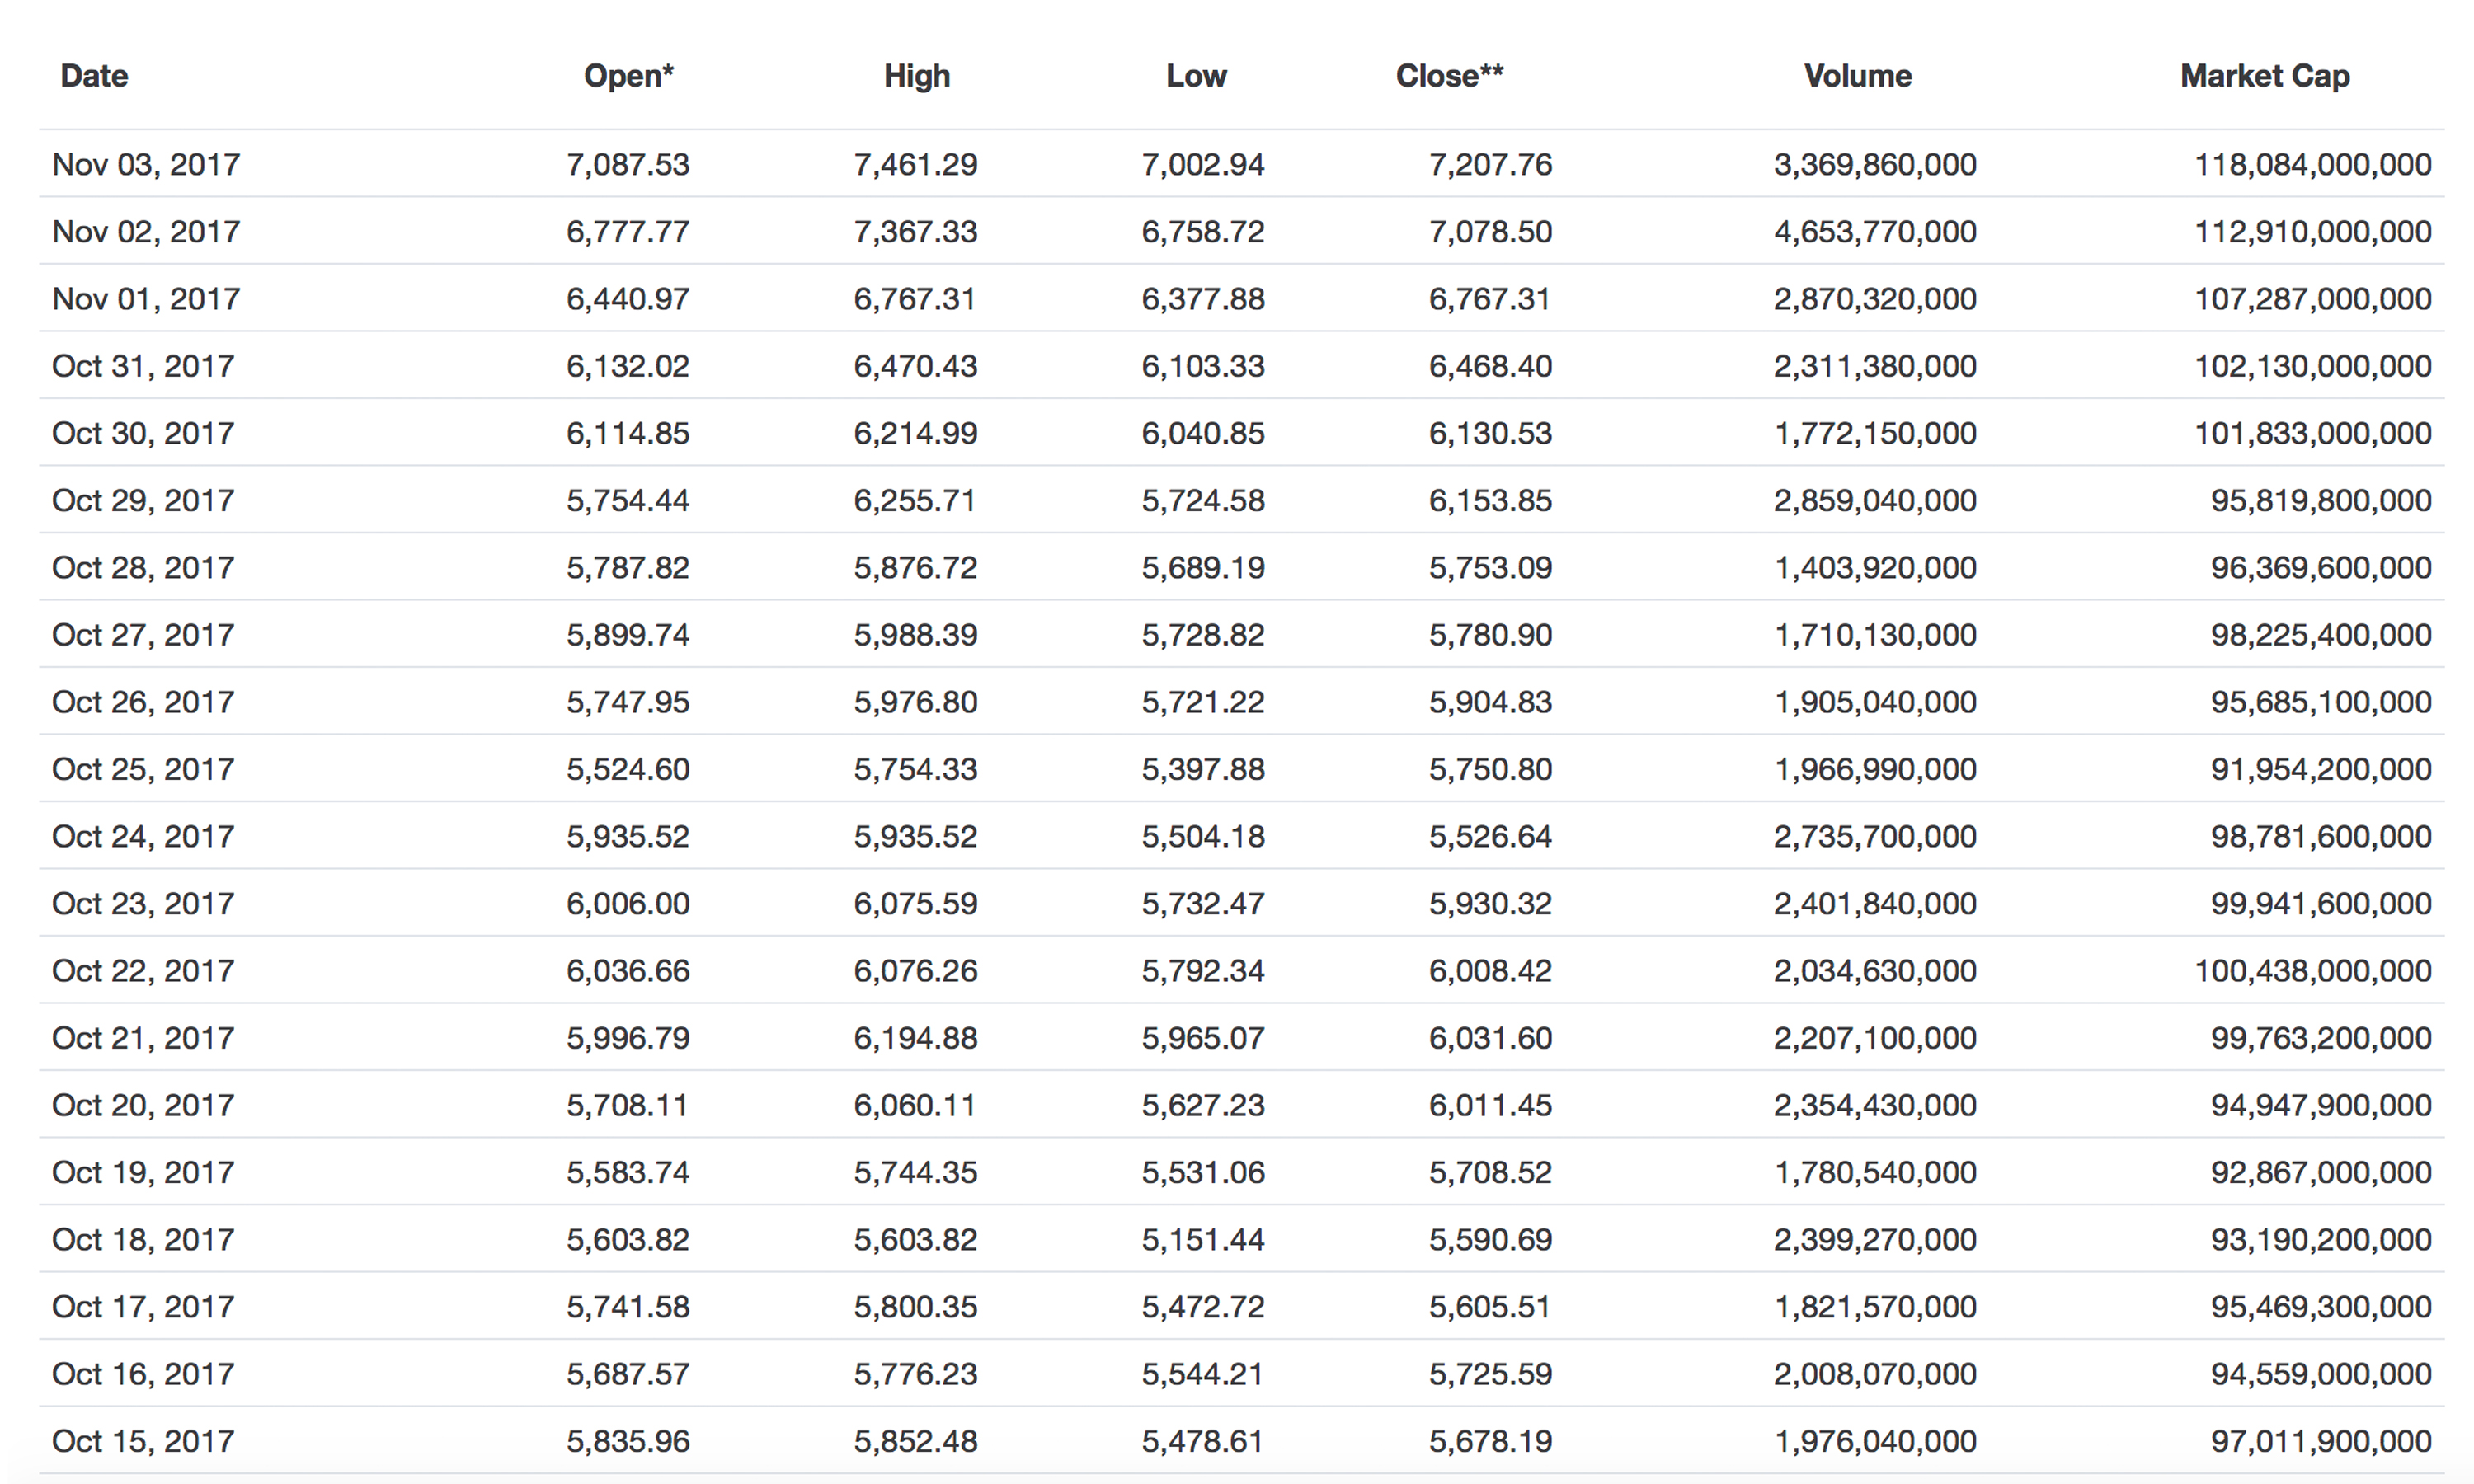
So many ask when was the best time to get in on BTC after markets have suffered through a significant loss. At prices today the best time to get in BTC without suffering any losses was prior to October 15, 2017, and any BTC purchases after this time have seen a percentage of their portfolio lose value.

The price of BTC touched its ATH on December 16, 2017, but that price did not last long. In fact, the price was only above the $19K mark for a mere 2 and a half days. So, in reality, there is only a small number of people who purchased BTC at this height. Six days later the price had dropped to $13,900 per BTC and people bought at this height have lost 56 percent. Then again the price jumped back up to $17,200 per coin and investors who got in here have lost 65 percent.

From that height of $19,600, there was a steady decline to around $6,600 on February 5, 2018, but there were a few fakeout spikes after that day. It’s likely that from February 5 up until the current vantage point saw most of the buying action at these prices following the intense dip. People who purchased BTC at this time could have possibly purchased at highs around $11,200 which shows a realized loss of around 46 percent.
The Bitcoin Cash ATH on December 20 Lasted Less Than a Day — Most Losses Between December and June 2018 Are Around 36-56%
According to Bitstamp on December 20, 2017, Bitcoin Cash (BCH) touched an all-time high of around $4,385 per coin. Now those who purchased at this height (which lasted far less than a day) have lost around 84 percent. The second jump in February 2018 saw BCH prices touch $3K per coin which indicates a loss of 76 percent. On May 5, 2018, BCH prices touched $1,600 per coin and this would be a loss of around 56 percent. The same could be said for most of the cryptocurrencies in the top ten market caps.
Moreover, if a Bitcoin Cash supporter decided to trade all of their BTC one week after the blockchain split one week later on August 8 they would have made much better gains today. If for example, the person had 20 BTC they would have been able to acquire roughly 209.31 BCH on August 8, 2017, with prices that day at $3,370 per BTC while BCH was $321. If the person kept the 20 BTC they would have roughly $120,000 at today’s BTC prices, meanwhile, 209.31 BCH would net them $146,517 USD on June 28, 2018.

So Far the 2018 Bear Run Has Been Less Severe As Far As Losses, But Crypto-Proponents Are Not Certain This is the Bottom
Most digital asset proponents are confident prices will regain previous levels and beyond, and surpass the ATHs that took place in December. The problem is enthusiasts don’t know when a trend reversal will take place, and if the current price has dropped to its lowest point. The bear run of 2014 all the way until the summer of 2015 was a very long period of time.

So far at least for the price of BTC bears haven’t managed to drag the price lower than $5,700-$5,900 per coin. They have tried to do so three times since the ATH. Currently, BCH prices are holding an average of around $710 and prices have not dipped below the $590 range yet. Because of these factors, some traders speculate this period of time could be the bottom; but because of all the bull traps over the past five months, and the last bear run in 2014, was well over twelve months today’s bearish sentiment may not be over. But so far it seems to be less severe than the bear runs year’s prior.
- Prices and the math in this article refer to a rough average of the spot price of $6,000 (USD) per BTC and $700 per BCH on June 28, 2018, at 12:00 pm EDT. Prices may have fluctuated since that time.
What do you think about the prices today in comparison with the last bull run and bear run throughout 2013-2015? Do you think 2017 will be similar and prices will drop even more or do you think this is the bottom? Let us know your thoughts in the comment section below.
Images via Pixabay, Coinmarketcap.com, Howmuch.com, and Wiki Commons.
At Bitcoin.com there’s a bunch of free helpful services. For instance, have you seen our Tools page? You can even lookup the exchange rate for a transaction in the past. Or calculate the value of your current holdings. Or create a paper wallet. And much more.
The post The 2018 Crypto-Bear Market Less Severe Than 2014, At Least for Now appeared first on Bitcoin News.

Bitcoin.com is author of this content, TheBitcoinNews.com is is not responsible for the content of external sites.
Our Social Networks: Facebook Instagram Pinterest Reddit Telegram Twitter Youtube


