Analysts are always seeking new ways to assess cryptocurrencies. Different metrics provide insights that can be used to gauge various trends, such as estimating when a particular asset has bottomed out and is due to rise. The Altcoin Correction Index provides an unvarnished snapshot of this year’s worst performing cryptos.
Also read: Blockchain, Reloaded: How the New “Matrix” Appeared
Altcoins Haven’t Performed This Badly Since 2014
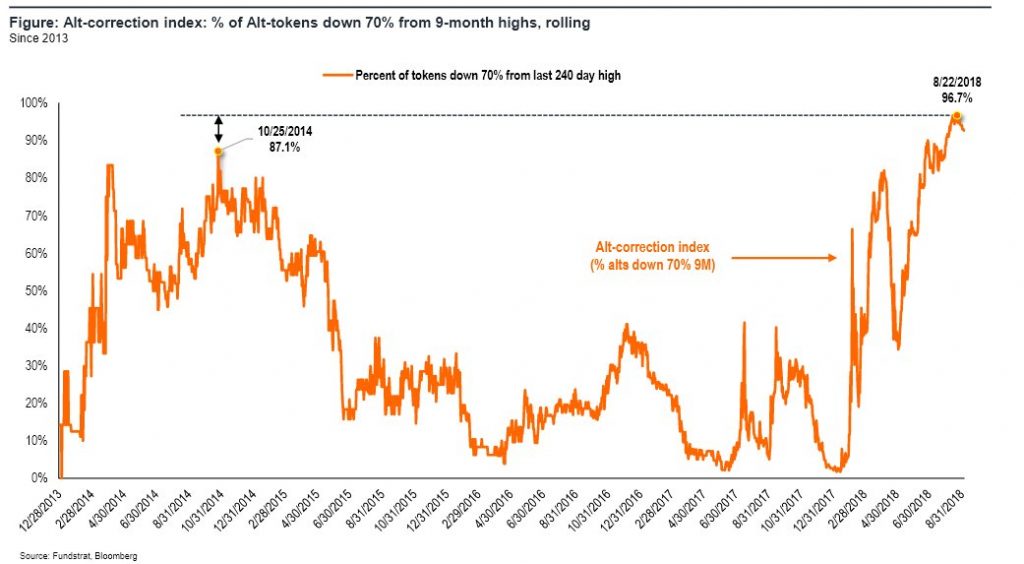
Whatever metric you choose to apply, altcoins aren’t looking so pretty this year. Just one crypto asset in the top 100 is in the green (BNB) while everything else is down an average of 70-90%. It doesn’t require sophisticated analytical tools to appreciate the extent of the altcoin bloodbath that has occurred. Nevertheless, historical trends can provide an indicator, some believe, as to when the worst may be over and a recovery can be expected. Fundstrat Global founder Thomas Lee has shared a chart he’s labeled the Altcoin Correction Index. It shows the percentage of altcoins that are down 70% from their 9-month high:

Websites such as Onchainfx are useful for viewing the number of days since an altcoin’s all-time high (ATH) and the percentage it is down. It’s easy to pick out particularly bad performers such as einsteineum (-98%), salt (-98%), and bitcoin diamond (-97%). Fundstrat’s Altcoin Correction Index is arguably more useful however in charting the average drop across the board, rather than focusing on outliers. With 97% of altcoins down over 70% from their ATH, nine months ago, the market has reached a low not seen since 2014.

In 2014, Altcoins Were Decimated
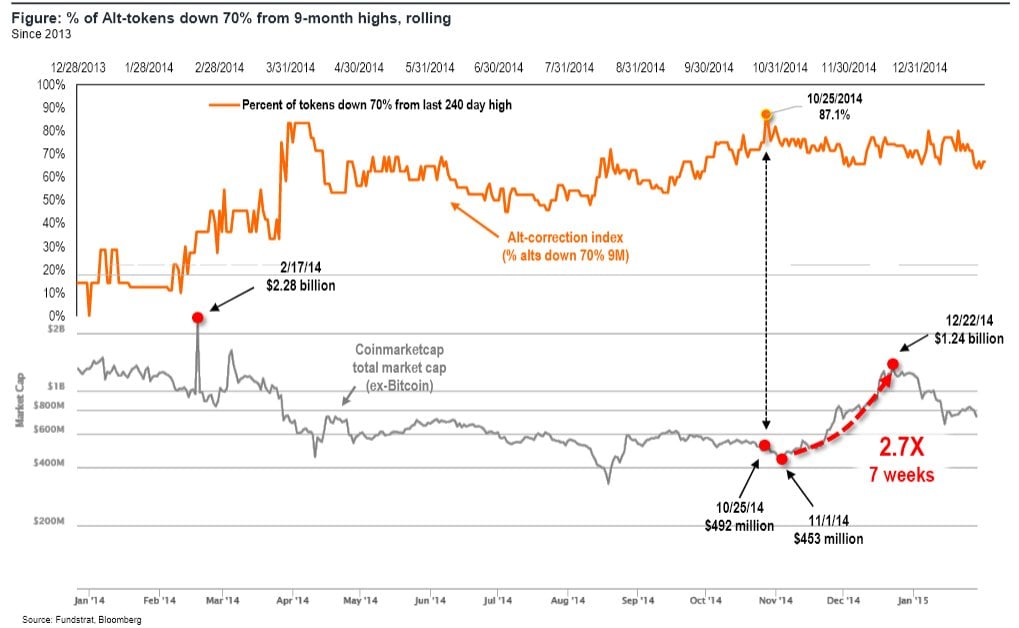
While out of touch economists continue to bang on about crypto assets going to zero, cryptocurrency holders who were there in 2014 know better. Some alts probably will go to zero, and deservedly so, but the notion that a mean 70% regression marks certain death is a false narrative. Shortly after alts reached their 2014 bottom, Thomas Lee notes, a mini-rally immediately followed which saw a 2.7x gain in just seven weeks. It does not follow that a similar event is about to occur in 2018; for one thing, there were less than 350 altcoins back then versus 2,000+ today. Nevertheless, it does demonstrate the foolishness of writing off cryptocurrencies just because they’ve been battered for a few months.

A look at the top ten cryptocurrencies in late October 2014, around the time that alts were previously at their all-time low, shows some familiar faces – plus a few coins that were already in terminal decline. Back then, bitcoin was at $350, followed by ripple at $.004, and litecoin at $3.71. Coins in the top 10 from that period that have since fallen out of fashion include peercoin, maidsafe, counterparty, and namecoin. Look outside the top 10 from October 2014 and, nestling at number 13, is a then-emerging privacy coin called monero. Today it’s down 78% from its all-time high of $495, set 243 days ago. Yet, back in October of 2014, you could have bought 1 monero for $0.72.
Cryptocurrencies might be having a bad year, but zoom out, and they’re doing just fine. Four years from now, some of the current crop will likely have died, but if history is anything to go on, the best of them could be worth multiples more.
Which cryptocurrencies do you expect to still see in the top 10 four years from now – and which ones will die? Let us know in the comments section below.
Images courtesy of Shutterstock, and Thomas Lee, and Coinmarketcap.
Need to calculate your bitcoin holdings? Check our tools section.
The post The Altcoin Correction Index Gives an Alternative View of Crypto Assets appeared first on Bitcoin News.

Bitcoin.com is author of this content, TheBitcoinNews.com is is not responsible for the content of external sites.
Our Social Networks: Facebook Instagram Pinterest Reddit Telegram Twitter Youtube


