


If you plan to invest or trade in cryptocurrencies, then having a charting application is essential for tracking your favorite coins. There are a number of alternatives out there, but TradingView is a leading platform for charting cryptocurrency price movements. Opening an account is free and has a number of neat features straight out of the box.
Chart Overview
Every chart displays a horizontal and vertical axis which tracks the corresponding timeframe and price of a financial asset. In the example below, we are looking at a daily chart of Bitcoin priced in US Dollars with a timeframe which spans from October of 2017 to May of 2018 at a price of $7 110.
Candlestick Price Action
There are several display options for price on this chart. Candlesticks are popular in the trading community because more information is available to you as a trader around what buyers and sellers are doing through each trading session. Green candles indicate an increase in price from the close of the previous candle and red candles vice versa.
Strong buying pressure is known as bullish price action while strong selling pressure is most commonly referred to as bearish price action. Markets can also trend sideways from time to time in which case you will notice the formation of candlesticks which often form what look like crosses. Candles provide 3 distinct pieces of information:
- Opening price
- Closing price
- High and low prices for the selected timeframe
It’s up to you how to interpret this information when making trading decisions. Other chart types that are also available include bar graphs, line, and area displays should you prefer something simpler.
Data Feed
By clicking on the symbol box, typing in your desired symbol and selecting the Cryptocurrency category, you can change the data feed to an exchange of your choice:
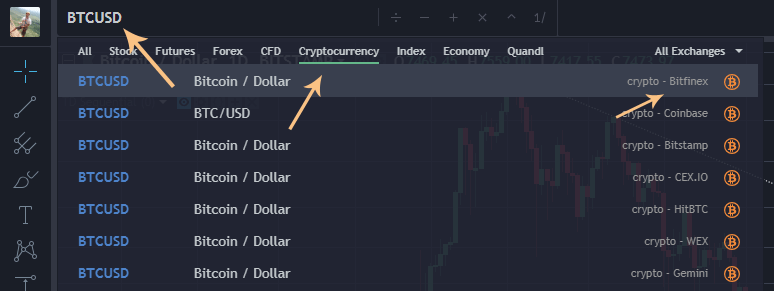
The feed for this chart comes from the Bitstamp exchange but keep in mind that there is no central price authority for cryptocurrencies like Bitcoin. Different exchanges may trade at different prices depending on supply and demand.
Know Your Symbols
Crypto vs Fiat
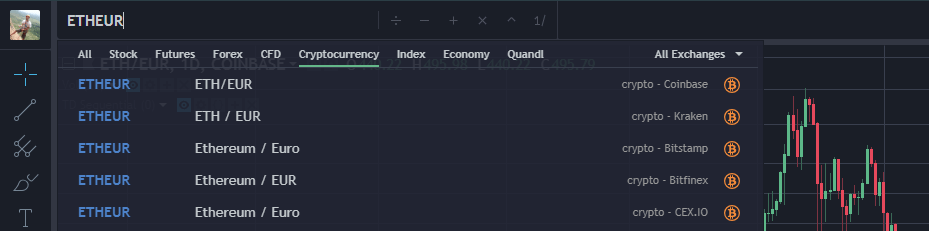
Every chart needs 2 competing assets to display price action. In the above example, we used Bitcoin (BTC) vs the US Dollar (USD). By joining their symbols you can display the BTCUSD chart. This symbol is often denoted in brackets as I’ve done above. Another way of conceptualizing this is to think of the price you pay in the second asset for every 1 of the first asset. In other words, $7 110 for every 1 Bitcoin.
You can do this with just about any other popular crypto or fiat currency such as the Ethereum Euro pair (ETHEUR). A fiat currency is any paper currency issued by a national government or economic area like the European Union.
Crypto vs Crypto
So far we’ve only covered pairs which trade against fiat currencies, but you’ll be glad to know that as the cryptocurrency sphere expands a whole host of new coins are coming to market, with the ability to trade them against each other.
The most popular crypto to crypto pair is the Ethereum Bitcoin (ETHBTC) one. This is the most liquid pair in the non-fiat world. Liquidity refers to how easy it is to buy and sell an asset, like a cryptocurrency, in a marketplace. Bitcoin and Ethereum are currently the 2 largest cryptocurrencies in the market and consequently, it is easy to get into and out of positions when trading ETHBTC.
Let’s use this pair to explore some additional tools in TradingView.
Tools Of The Trade
Technical Indicators
In the following ETHBTC chart, I’ve added 2 popular technical indicators at screen bottom to aid me in making buy and sell decisions. The RSI (Relative Strength Index) and MACD indicators can be added by right-clicking anywhere on a chart, selecting “Insert Indicator” and searching for the corresponding tool. There is an overwhelming number of options available in the “Indicator & Strategies” popup so I recommend you play with some options and do additional research to find something that works for you.
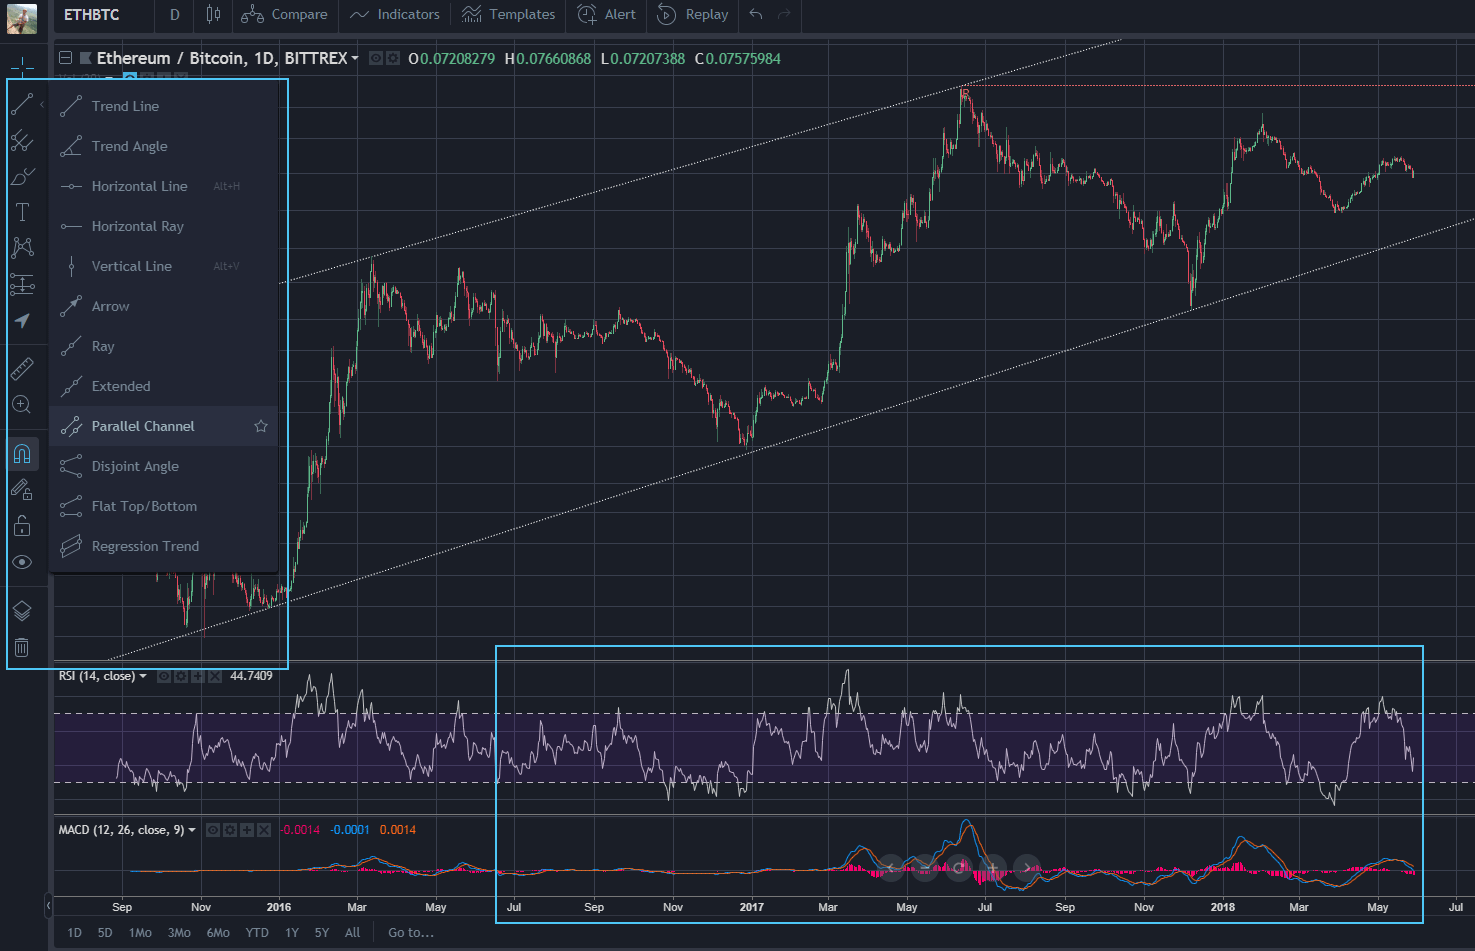
It is also advisable not to crowd your workspace with indicators. At the end of the day, what matters is what the price is doing, not what your indicators are doing. Remember this.
Drawing Tools
At screen left, there are a number of tools which can be used to draw on your chart. As you can see I have drawn some trend and resistance lines showing the general trajectory of prices. The overall theme can be interpreted as bullish price action since 2016. In fact, if you had bought Ethereum as it went live and held up to the present day, you would have made a greater return in comparison to holding Bitcoin. Over this period Bitcoin rose 27.5 times against the US Dollar while Ethereum rose 450 times. If you had invested $1000 in Ethereum in September 2015 you would have a whopping $450 000 today!
Analytics & Social
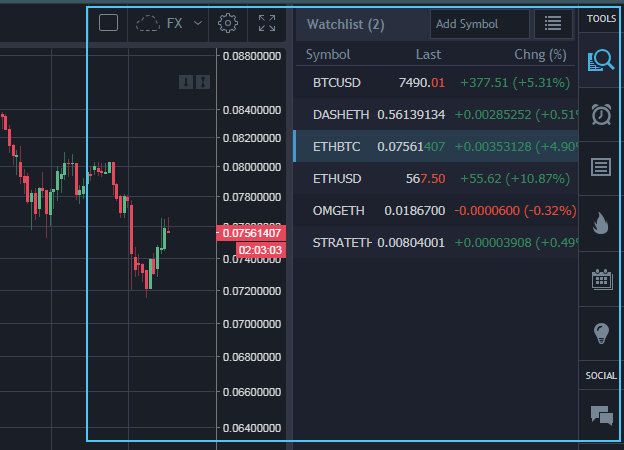
At screen right, you’ll want to take advantage of features like:
- Chart Layouts – Save preferences, drawings, and indicators for future sessions
- Symbol Watchlist – Keep tabs on daily market moves for your favorite pairs
- Price Alerts – Be notified when predetermined price levels are hit
- Social Trading – Chat with other traders to get an idea of market sentiment
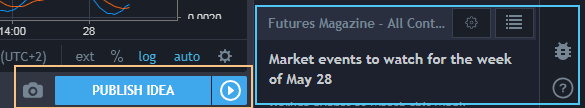
A useful news panel is located in the bottom right of the screen to keep you up to date on market happenings. TradingView provides a nifty Publish Idea option for your chart which allows you to put yourself out there when making price predictions. Nobody makes perfect trading decisions and getting different points of view and constructive criticism is valuable for improving your process.
Tying It All Together
There are no hard and fast rules when it comes to charting in TradingView, or any other application for that matter. If you find their platform useful, consider supporting them with a pro subscription to gain access to additional features.
I have only just scratched the surface on where your charting can take you. This can be just as much an art as it is a science. Where one man sees rubbish, another sees gold. This is what makes a market!
Also, remember that charting typically goes hand-in-hand with technical analysis which is only one half of the investing mindset. Time spent learning the tools and observing the market is time well spent.
“The expectations of life depend upon diligence; the mechanic that would perfect his work must first sharpen his tools.”
Confucius
The post A Primer on Cryptocurrency Charting in TradingView appeared first on CoinCentral.

Coincentral.com is author of this content, TheBitcoinNews.com is is not responsible for the content of external sites.
Our Social Networks: Facebook Instagram Pinterest Reddit Telegram Twitter Youtube


