


The struggle of Bitcoin in this bearish market continues throughout this week as well. Since its major downfall in January (from $20,000 to $8,000), the number one cryptocurrency is yet to find a way to engineer a major trend reversal. On the other hand, its hard fork Bitcoin Cash seems to gain some ground over the past few days and is looking to bring in some potentially good news for the investors. At the time of writing (i.e. 13th July 2018), Bitcoin is holding the number one position with a price equivalent to $6,257.16 and BCH is holding the fourth position on Coinmarketcap right behind Ripple with a price of $698.74.
Here, you would find comprehensive price analyses of both of these currencies to have some idea about their probable future.
Bitcoin (BTC/USD)
Price Analysis
- High: $6284.05USD
- Low: $6243.53 USD
- Major Resistance Level: $6,600 USD
- Hourly MACD: Placed slightly in the sell zone with range bound movement predominantly.
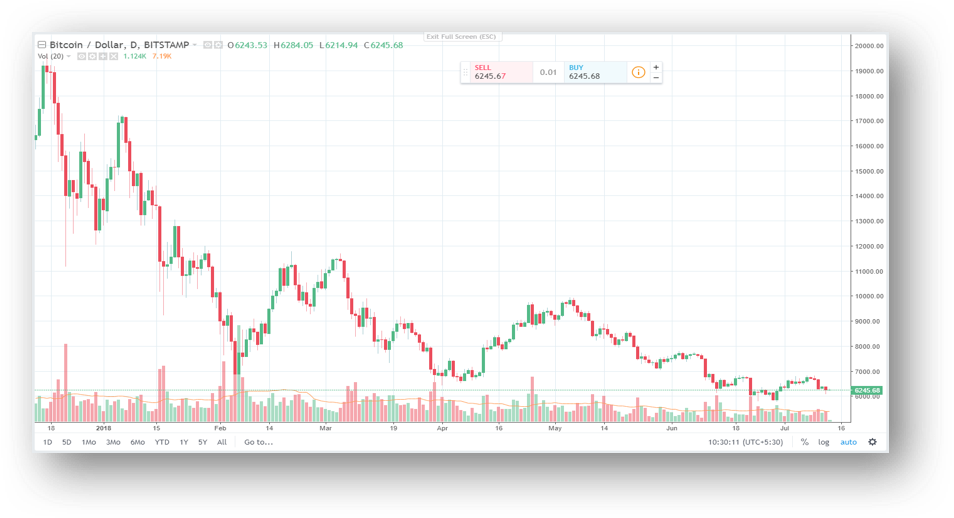
Bitcoin is veering around the $6,200 mark at the moment with a steep bearish trend. Trading experts and crypto-connoisseurs have been speculating that the sudden drop of the crypto-market by 10 billion USD over the past two days has invariably caused this major downfall. At one point, Bitcoin’s price dropped to a figure of $6,150. Although the currency has managed to do some damage control since then, the trend is still a bit bearish. Bitcoin is exhibiting an oversold co0ndition with alarmingly low relative strength index (RSI). As long as the value of RSI does not increase, the struggle of BTC to rebound by attempting a corrective rally is likely to continue. According to many speculators, the only feasible way for Bitcoin to commence a rebound is to reach the $6,600 as soon as possible. Fortunately, the market sentiment of such coins change in the blink of an eye and the difference between the moving averages is slowly decreasing. Once BTC reaches the major resistance level, the traders can expect a reversal in the current bearish trend.
Bitcoin Cash (BCH/USD)
Price Analysis
- High: $706.60 USD
- Low: $684.60 USD
- Major Resistance Level: $780 USD
- Hourly MACD: Placed slightly in the buy zone.

Unlike Bitcoin, its first hard fork BCH is showing some improvements in its price chart over the past few hours. At the moment of writing, the price of Bitcoin Cash is revolving around the $ 700 mark with a bullish trend. Also, over the past week, this coin has managed to place itself in the buy zone. On implementing the Fibonacci Retracement Tool, we would be able to observe that the difference between the moving averages is decreasing thereby bespeaking the fact that this new bullish trend is likely to sustain for the next few days at least. Also, the RSI is on the higher side which also indicates a bullish run.
To sum up, this is looking good for the BCH holders at the moment with its bull run. However, for BTC holders, the scenario is a bit bleak. But as we all are aware of the volatile nature of this market, it is only a matter of time before Bitcoin exhibits a reversal in its current price trend.
Happy Trading!!
For the latest cryptocurrency news, join our Telegram!
Disclaimer: This article should not be taken as, and is not intended to provide, investment advice. Global Coin Report and/or its affiliates, employees, writers, and subcontractors are cryptocurrency investors and from time to time may or may not have holdings in some of the coins or tokens they cover. Please conduct your own thorough research before investing in any cryptocurrency and read our full disclaimer.
Image courtesy of Pexels
Charts courtesy of tradingview.com
The post Bitcoin, Bitcoin Cash Price Analysis: What’s the Current Condition? appeared first on Global Coin Report.

Globalcoinreport.com/ is author of this content, TheBitcoinNews.com is is not responsible for the content of external sites.
Our Social Networks: Facebook Instagram Pinterest Reddit Telegram Twitter Youtube


