


As the bear market in the cryptocurrency complex rolls on with seemingly inexhaustible selling pressure, it is natural for traders to try and look for technical signals of a bottom before a bottom is actually made.
As we take a close look at the charts for Bitcoin (BTC) and Bitcoin Cash (BCH), it’s important to keep this in mind. As technicians often note, “The trend is your friend, until the end, when it bends.”
This is not meant to be mysterious for the sake of being mysterious. While many things can be counterintuitive in the world of technical analysis, in this case, the picture is relatively straightforward.
Bitcoin (BTC)
Price Analysis
- High: $6253.7
- Low: $5898.3
- 24-Hour Volume: $4.55B
- 7-day Percent Change: -14.29%
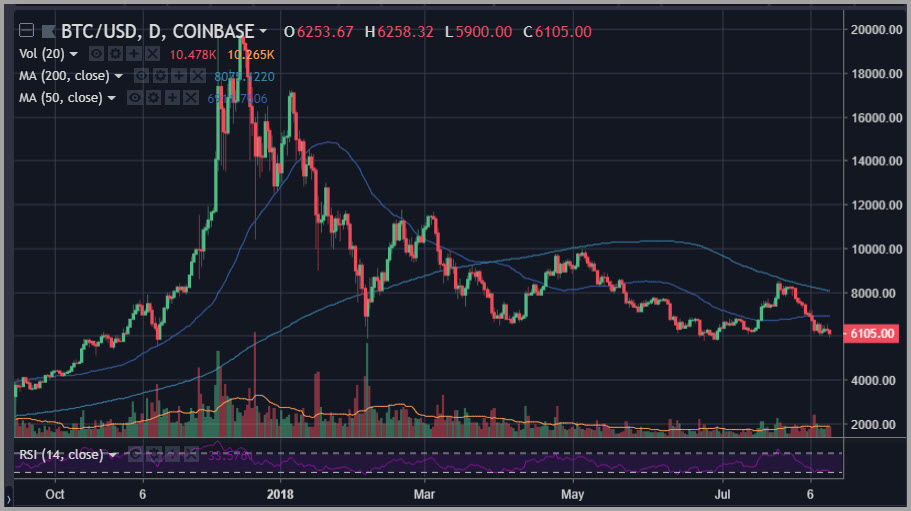
As noted above, the action right now is defined as a bear market context. Indicators and the Bitocin price have rolled over. Coins are trading below major moving averages. And volume is starting to rise on the downside as levels are taken out.
Bitcoin (BTC) has managed to avoid taking out most of its major levels so far, with the $6000 level only taken out last night.
At this point, all eyes are going to be fixated on the $5800 level as a last-ditch support before we start logging new 2018 lows.
Because the retail public and most financial media outlets all focus on the Bitcoin price as being the defining central point of the cryptocurrency complex, new 2018 year-to-date lows may spur some headlines that create the possibility of a self-reinforcing feedback loop of demoralization.
While that sounds like an awful outcome, it may, in fact, be the best thing that could happen right now. It’s important that we shake out the weak hands in coins like BTC and find a new base of support before moving higher so the next rally isn’t a false one.
Bitcoin Cash (BCH)
Price Analysis
- High: $531.29
- Low: $474.37
- 24-Hour Volume: $407.69M
- 7-day Percent Change: -28.78%
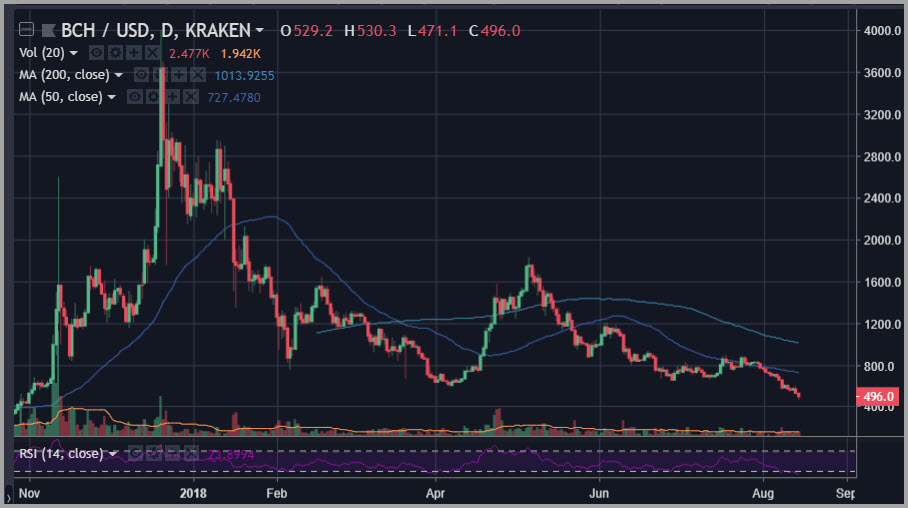
Bitcoin Cash (BCH) had been a clear point of relative strength, forging a bullish ascending triangle (that never triggered) and showing extra gusto during the spiking rallies recorded last month.
However, since then, we’ve seen a series of sloped and lateral support levels broken with ease like a hot knife slicing through butter. Bitcoin Cash (BCH) has become a point of relative weakness during this decline that has lasted over the past couple of weeks.
As should be clear on the chart above, the April lows are now toasted. All eyes will start to fixate far below the $300 level as the important line in the sand if current weakness persists in BCH.
Happy Trading~
To trade cryptocurrencies, sign up with Binance!
Disclaimer: This article should not be taken as, and is not intended to provide, investment advice. Global Coin Report and/or its affiliates, employees, writers, and subcontractors are cryptocurrency investors and from time to time may or may not have holdings in some of the coins or tokens they cover. Please conduct your own thorough research before investing in any cryptocurrency and read our full disclaimer.
Image courtesy of Pexels
Charts courtesy of tradingview.com
The post Bitcoin (BTC) Bitcoin Cash (BCH) Price Analysis: The Straight Dope appeared first on Global Coin Report.
Read more at https://globalcoinreport.com/bitcoin-price-analysis-the-straight-dope/

Globalcoinreport.com/ is author of this content, TheBitcoinNews.com is is not responsible for the content of external sites.
Our Social Networks: Facebook Instagram Pinterest Reddit Telegram Twitter Youtube


