


The process that we have witnessed defining the action across the broad cryptocurrency space over the past two months has been a bit of a roller coaster ride for some coins, while it has been an elevator shaft for others.
As we take a close look at the charts for Bitcoin (BTC) and Ethereum (ETH), we are really looking at one roller coaster ride and one elevator shaft. But it’s important to not only understand the tone of recent action but to use the tools of technical analysis to lay out a landscape of projections for what comes next.
Bitcoin (BTC)
Price Analysis
- High: $6524.1
- Low: $6306.5
- 24-Hour Volume: $5.70B
- 7-day Percent Change: -9.82%
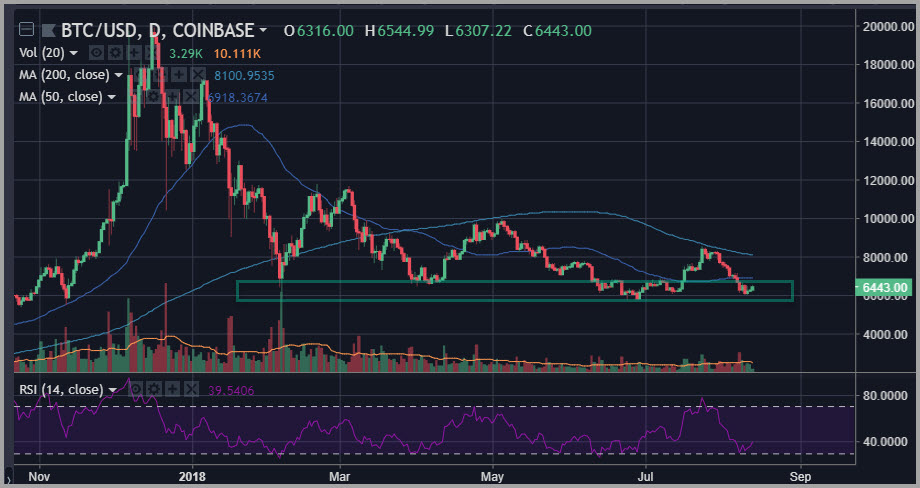
The action in Bitcoin (BTC) has been a miniature Christmas tree since the middle of July, with a rocket to the upside from the $6000 support level to test a declining 200-day simple moving average. That then rolled over and led to a move right back down to retest the $6000 level.
Easy come easy go.
Naturally, this is all about possibly carving out a base of support around this $6000 level – an idea that’s being put to the test now in an official capacity.
With the recent decline, we are beginning to roll the 50-day simple moving average back over into a downward slope, but Bitcoin (BTC) is still fighting to hold support and rebound.
For Bitcoin (BTC) HODLers, right now we’re seeing a fistfight that is expressing itself on the chart as a bit of asymmetric triangle pattern beginning to take shape on the hourly chart. Look for a resolution to this triangle early this week to give an indication as to where this coin heads next.
Ethereum (ETH)
Price Analysis
- High: $321.22
- Low: $313.82
- 24-Hour Volume: $1.69B
- 7-day Percent Change: -21.67%
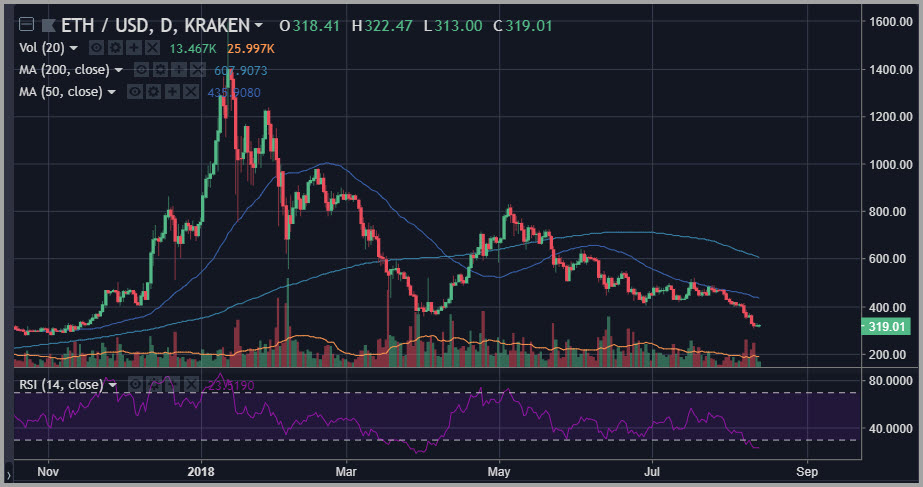
The action in Ethereum (ETH) has been much more directional and much more bearish over the past month, with the July bounce manifesting itself only as a bearish flag pattern that eventually found form in a trigger release to the downside following a rub against its 50-day simple moving average.
Over the last 72 hours, we have seen Ethereum (ETH) break underneath its March lows to score new year to date lows for the 2018 campaign.
Oscillators are beginning to show severely oversold readings, with the 14-day RSI measure testing a 20 print.
The question now is more about whether or not we are approaching seller exhaustion than anything else. Support on a further extension to the downside in ETH comes into play on a price level basis at $275.
Happy Trading~
To trade cryptocurrencies, sign up with Binance!
Disclaimer: This article should not be taken as, and is not intended to provide, investment advice. Global Coin Report and/or its affiliates, employees, writers, and subcontractors are cryptocurrency investors and from time to time may or may not have holdings in some of the coins or tokens they cover. Please conduct your own thorough research before investing in any cryptocurrency and read our full disclaimer.
Image courtesy of Pexels
Charts courtesy of tradingview.com
The post Bitcoin (BTC) Ethereum (ETH) Price Analysis: The Ride and the Shaft appeared first on Global Coin Report.
Read more at https://globalcoinreport.com/bitcoin-btc-ethereum-eth-price-analysis-the-ride-and-the-shaft/

Globalcoinreport.com/ is author of this content, TheBitcoinNews.com is is not responsible for the content of external sites.
Our Social Networks: Facebook Instagram Pinterest Reddit Telegram Twitter Youtube


