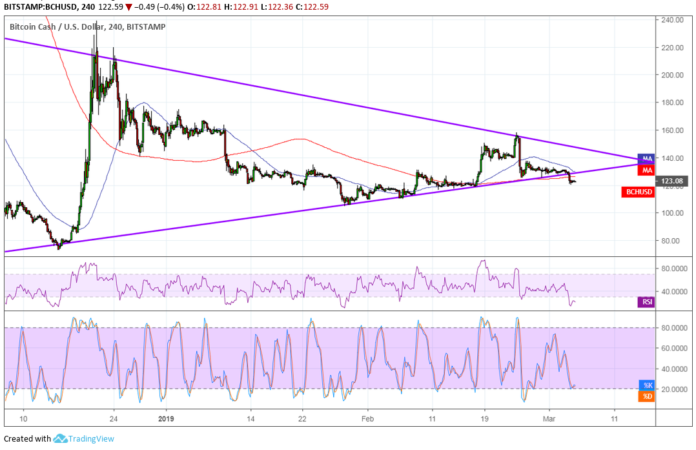
Bitcoin Cash was previously consolidating inside a symmetrical triangle visible on the 4-hour chart before breaking below support. This signals that price could be in for a slide that’s the same height as the chart formation.
The triangle spans $80 to $220, though, or $140 in size. The 100 SMA is above the longer-term 200 SMA to signal that the path of least resistance is to the upside, but the gap between the indicators has narrowed enough to show that a bearish crossover is imminent. Price is also moving below both dynamic inflection points to indicate that these would hold as resistance moving forward.
However, RSI has already made it to the oversold region to reflect exhaustion among sellers. Turning back up could encourage buyers to hop in, possibly for a retest of the broken triangle bottom or a move back inside. Stochastic also looks ready to turn higher without dipping to the oversold region, so bulls might be eager to charge again.
There have actually been a few positive developments for Bitcoin Cash lately, with more exchanges looking to list this coin on their platform. This could usher in stronger volumes that might allow trends to gain better traction.
However, the downturn in sentiment across the entire cryptocurrency industry has also impacted Bitcoin Cash movement. Traders seem to be in profit-taking mode as the February rallies weren’t sustained, leading to speculations that another bottom might be due.
Roger Ver has shared some BCH updates in a video post recently. In particular, he mentioned CashShuffle, which is an application aimed at making transactions and purchase more fungible. He said:
“CashShuffle is both a protocol and an implementation for Bitcoin Cash privacy-enhanced transactions, based on the CoinShuffle protocol.”
This would allows users to combine their transactions with others without risk of lost funds and no additional fees.
cryptocrimson.com is author of this content, TheBitcoinNews.com is is not responsible for the content of external sites.
Our Social Networks: Facebook Instagram Pinterest Reddit Telegram Twitter Youtube


