


Bitcoin is fast approaching the longest downward price streak in its ten-year history. The question among some analysts is what happens next?
402 Days and Counting
Between November 2015 and January 2017, the top-ranked cryptocurrency experienced its most protracted price correction lasting 410 days. Ultimately, BTC price 00 bottomed out before a period of accumulation and sideways trading, which set up the bull market of 2016/2017.
This bull run culminated in the mid-December 2017 all-time high (ATH) of about $19,700. Since the start of 2018, BTC has been in another prolonged downward spiral. Unless BTC stages a significant recovery, February 2, 2019, will mark a new record for the longest Bitcoin price correction.
$BTC correction record:
On Feb 2nd, we are likely to break the record for longest Bitcoin correction: 410 days (from Nov 2013 to lowest price at Jan 2015)
Very soon, you will be able to say that you survived the longest crypto market correction in $BTC history pic.twitter.com/Mag1Nq5tyo
— Josh Rager
(@Josh_Rager) January 24, 2019
History Repeating Itself?
Recently, market analysts like Josh Rager and Galaxybtc have taken to Twitter, talking about the impending record and the implications for the market. For Galaxybtc, if history does repeat itself, then BTC is likely to start a new bull cycle sometime between the fall and winter 2019.
Giving credence to this theory is the notion that Bitcoin is parabolic an examination of BTC’s logarithmic price action shows a similar setup between 2013-2015 and 2018-present. BTC fell more than 80 percent during the price rout during both periods.
“The future lies in the study of the past”
We’re approaching the 420 day mark which ended the 2015 bear market and if history repeats itself, we’re moving towards several months of accumulation and a new bull cycle starting mid-late 2019. $BTC #bitcoin pic.twitter.com/VX8ok9oFue
— Galaxy (@galaxybtc) January 14, 2019
However, while the charts paint a similar picture for both periods, the market awareness appears vastly different. Bitcoin is no longer an obscure asset but a major topic along economic, political, and social lines.
This increased market awareness has brought on greater regulatory scrutiny in the market as well. A lot of the focus is on market manipulation, which some commentators say has been responsible for many of Bitcoin’s sharp price spikes.
BTC Bottom and Reward for HODLers
If the cyclical price pattern is to continue, however, BTC must establish a long-term bottom. When Bitcoin first fell to $6,000 back in February 2018, talk of a bottom price dominated the discourse in the industry. During the mid-November 2018 slide, BTC price resisted two attempts to go below the $3,000 mark.
1/ Let’s go on a little journey. What if the history does indeed rhyme? pic.twitter.com/VDSonz68Gw
— Murad Mahmudov
(@MustStopMurad) January 13, 2019
For Bitcoin analyst, Murad Mahmudov, it is more a situation of history rhyming than repeating itself. According to Mahmudov, the BTC bottoming out process has two final legs; baby capitulation and final capitulation.
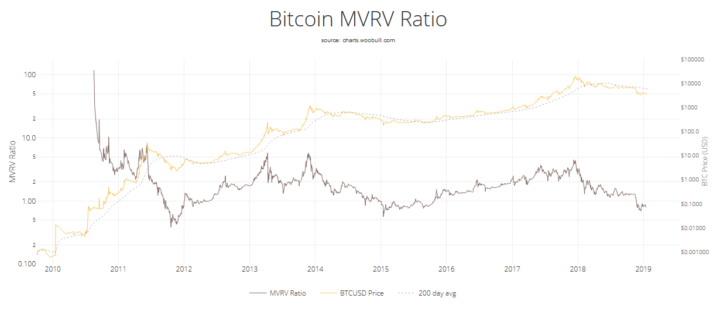
Expanding on Mahmudov’s reasoning, Woobull.com creator, Willy Woo presented a chart on Friday supporting the narrative of two more declines before BTC bottoms out.
Back in November 2018, BitMEX chief, Arthur Hayes predicted a prolonged bear market that could last 18 months at the time. He also pegged his BTC bottom between $2,000 and $3,000.
The 2013-2015 bear market gave rise to the term “Hodl,” which has become perhaps the most iconic term in Bitcoin lingo. For Bitcoin enthusiasts, the hope will be that history repeats itself with BTC reaching a new all-time high probably in 2021 and 2022 after the next halving sometime in May 2019.
The silver lining for Bitcoin holders, however, can be found in the Bitcoin dominance index. The figure has actually risen throughout 2018 from an all time low of 33 percent when price was at its peak to roughly 52 percent today.
Do you think history will repeat itself with Bitcoin seeing a new all-time high in the near future? Let us know your thoughts in the comments below.
Images courtesy of Twitter (@Josh_Rager, @galaxybtc, and @MustStopMurad) and Woobull.com, Shutterstock
The post Bitcoin Closing In On Longest Price Slump in History appeared first on Bitcoinist.com.

Bitcoinist.com is author of this content, TheBitcoinNews.com is is not responsible for the content of external sites.
Our Social Networks: Facebook Instagram Pinterest Reddit Telegram Twitter Youtube


