


Despite dropping by about $1,000, Bitcoin is still way ahead of even some of the most optimistic price projections and detailed price forecast models. Here is a look at how Friday’s ‘flash crash’ hasn’t derailed Bitcoin in the long term.
Current Bitcoin Price Still Leads $1 Million S2F Model
Tweeting on Saturday (May 18, 2019) Bitcoin analyst “planB” showed how even at $7,300, BTC still leads the stock-to-flow (S2F) model about $1,000 on the road to hitting $1 million per coin.
#bitcoin at $7300 .. $1000 above S2F model value
pic.twitter.com/2VkSiP4Oc0
— planB (@100trillionUSD) May 18, 2019
PlanB’s S2F model posits that scarcity and value have a direct relationship with scarcity being a measure of stock flow (SF). The analysis also takes into consideration important parameters like Bitcoin block reward halving which occurs every four years until all 21 million BTC are mined.
According to the model, by the time of the next halving which is in May 2020, BTC’s SF should double from its current value of 25 to 50. This doubling would bring BTC’s SF closer to that of commodities like gold.
BTC permabulls like Max Keiser say Bitcoin has the potential to reach a fraction of the gold market capitalization, which is somewhere in around $8 trillion. The S2F model predicts that by 2020, BTC should have a market price of $55,000 based on an SF value of 50.
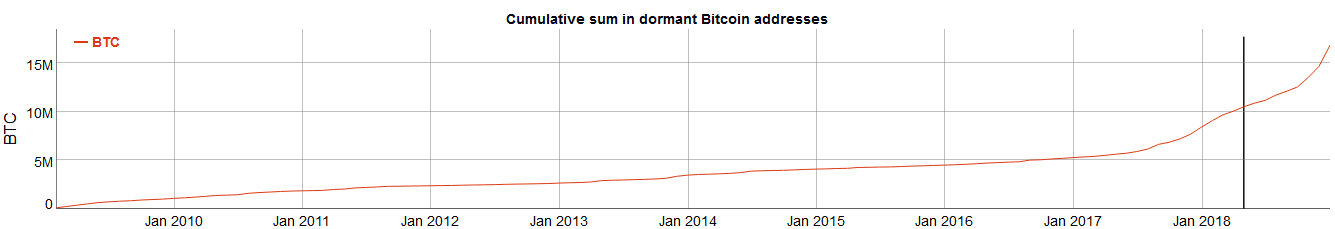
S2F hinges heavily on scarcity which for BTC takes on another dimension given that a portion of the 21 million total token supply isn’t even attainable since some BTC are forever lost.
Data from BitInfoCharts shows that there are about 16.82 million BTC held in dormant Bitcoin addresses. Between cumulated BTC dust and lost private keys, there are about 10.5 million BTC that haven’t moved in over a year.
Perfect Pullback?
Before the Friday price drop, there had been the talk of a possible retracement in the BTC price action to the mid-$6,000 level. These predictions hinged on massive profit taking above $7,000, creating another entry point for a new BTC accumulation in preparation for a fresh upward swing.
In the short-term, there is an expectation that BTC might slip further downwards perhaps to the 50-day or 200-day moving average support levels. This puts a possible downward slide between $4,500 and $5,500.
However, such a move would mean breaking the $6,400 support level which characterized BTC trading for most of 2018. Only the fallout from the Bitcoin Cash civil war in November 2018 successfully took BTC below that price level.
Do you think the flash crash adversely affected Bitcoin’s parabolic advance? Let us know in the comments below.
Images via Twitter @100trillionUSD and BitInfoCharts.com, Shutterstock
The post Bitcoin is Front Running Stock to Flow Price Model at $7300 appeared first on Bitcoinist.com.

Bitcoinist.com is author of this content, TheBitcoinNews.com is is not responsible for the content of external sites.
Our Social Networks: Facebook Instagram Pinterest Reddit Telegram Twitter Youtube


