


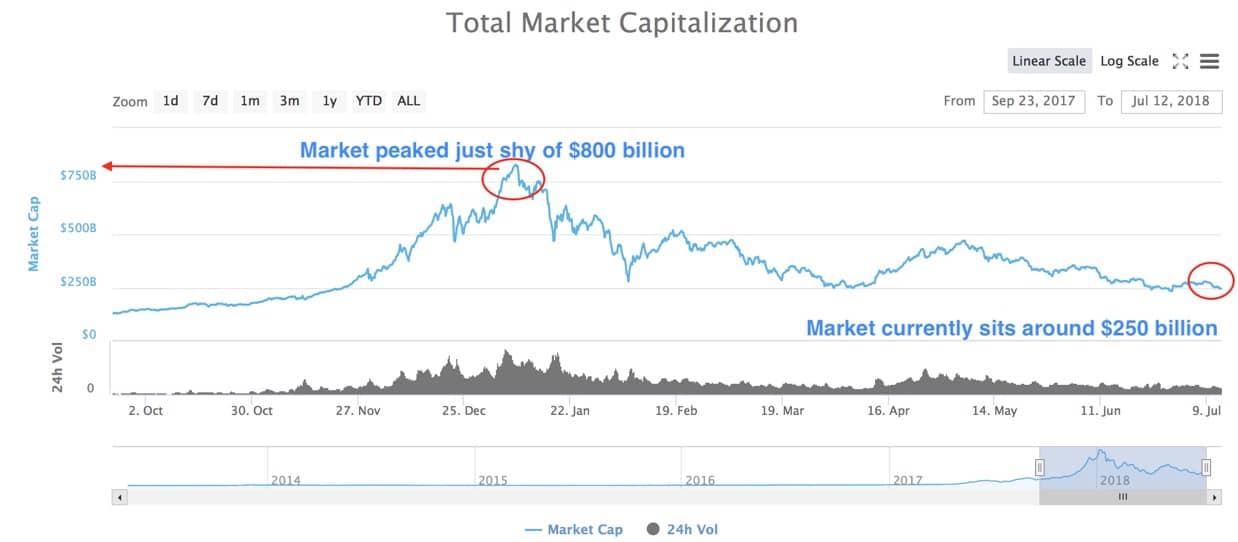
Let’s take a look at the prices of some of the recent biggest movers in market history. What movers are we talking about? We are talking about crypto-assets of course. At the end of last year, the value of all traded cryptocurrencies rose to almost $800 billion dollars.
However, that value has now dropped more than half and sits at around $250 billion dollars. See the chart below which shows the rise in market capitalization at the end of 2017 through to the present value today.
Bitcoin and the associated cryptocurrencies are based upon a disruptive new facility called Blockchain. Blockchain technology allows for a decentralized shared ledger which can be simultaneously updated across the whole system with just one entry in one place.
In terms of the market share Bitcoin holds the largest share of the crypto market and currently claims 43% of the share. Ethereum, Bitcoins largest rival, totals around 17.4% of the market. Ripple has 7.2% and Litecoin around 2%.
The other higher share crypto participants are Bitcoin cash at 5.2% and EOS coming in at 3%. It can be very confusing at first seeing the variety of coins that are available. So why are there so many different coins? The main reason is to do with the limitations of Bitcoin. Bitcoin has a total coin limit of 21 million. Litecoin, by contrast, has a limit of 84 million.
The average block confirmation time of Bitcoin is 10 minutes, but only 2 and a half minutes for Litecoin. The constant desire to improve the various flaws of Bitcoin has led to the large number of alternative-coins to Bitcoin, called alt-coins.
Crypto-assets are controversial with varying claims about their future. They are also hard to hold onto, A recent article by the Wall Street Journal reported that 20% of all crypto-assets are, in fact, lost. Purchasers store their ‘coins’ in virtual wallets which are protected by long passwords. Once users lose their passwords the coin is unrecoverable.
They calculate that over $40 billion worth of Bitcoin is actually lost. Purchasers are even being reported to be hiring hypnotists to try and help them remember their lost passwords. Ultimately the future of Bitcoin and its associated crypto-assets remains to be seen.
However, by using technical analysis it is possible to find excellent places to define and limit your risk as you trade the volatile markets of crypto-assets. Let’s now look at the current prices of some of the most popular coins.
Suggested articles
Krypton Software Rolls Out New Innovative Platform, KryptonInvestGo to article >>
Bitcoin, the most popular crypto-currency, is currently trading in a range from $6764 to around $5752. Down from its lofty highs of around $20000 at the start of the year it is in a definite doldrum. In the near term, each time price has tried to rally above $6800 sellers have come in and sold off Bitcoin using the 200 MA to define their risk. Most recently that level coincided with the top of the daily range at $6764.27.
The bottom of the range looks set to get tested again soon and that bottom also forms yearly lows for Bitcoin. A break of those lows will see $5300 as the next likely target. For longer term investors who are expecting Bitcoin to rally again in the medium-term future this is certainly a place of value to buy from.

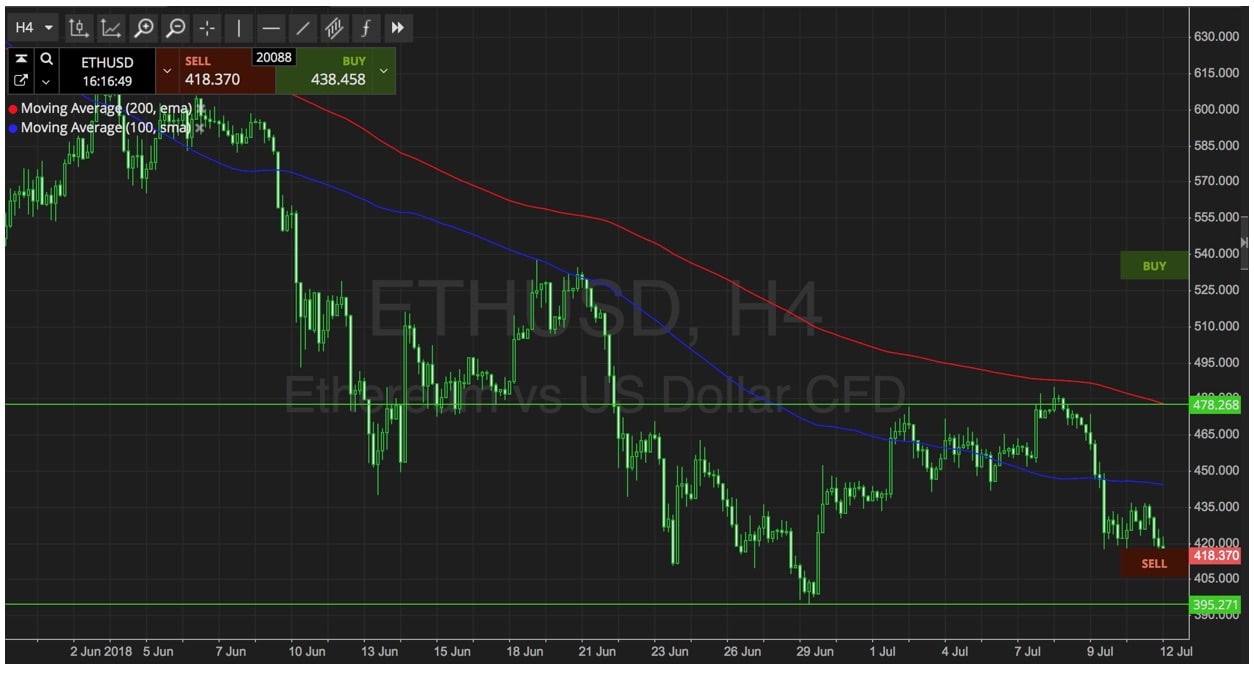
Ethereum too has been in a steady down trend on the 4-hour chart selling off against the 100 and 200 Moving averages as price has stepped downwards. Near term resistance is overhead on the daily chart at $478.26 and support is just below current price at $395.27. Traders can look to lean against the overhead resistance level at $478 to try and rejoin the downtrend.
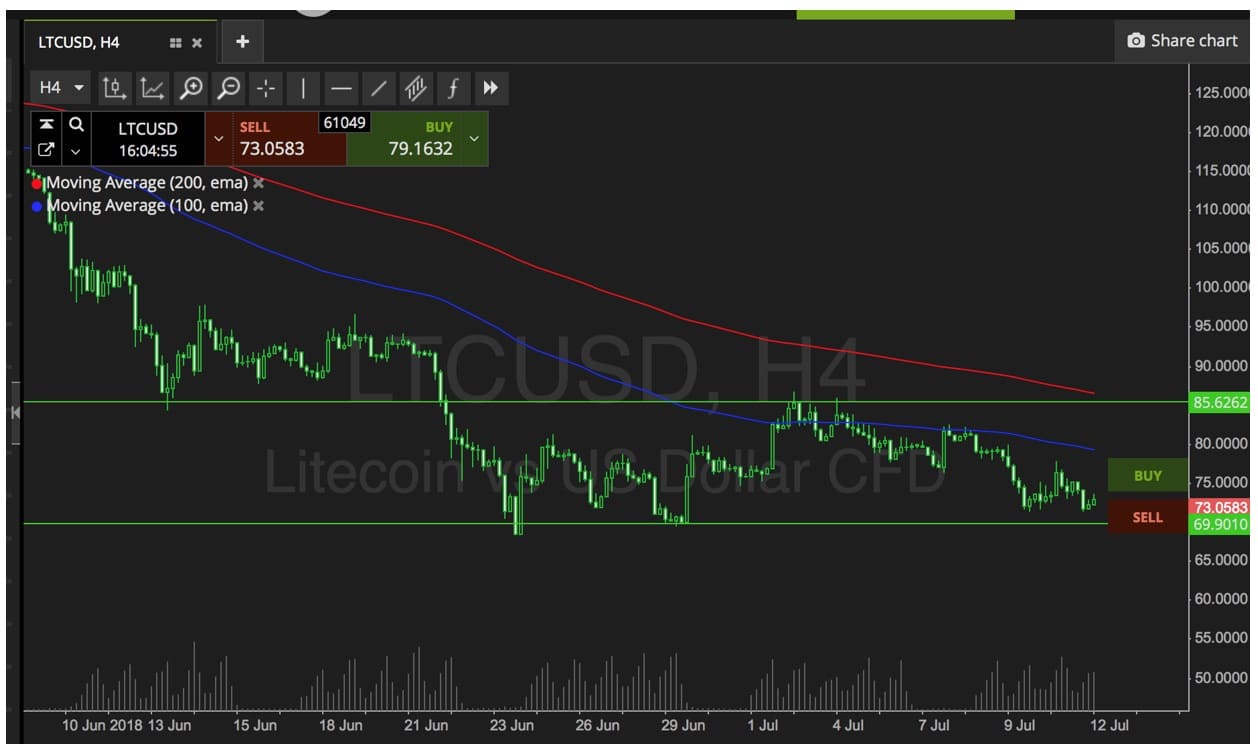
Litecoin has a similar range to Bitcoin from mid-June through to mid-July which it is currently sitting in towards the bottom at $73.06. Price has been contained within $85.62 on the upside through to $69.90 on the downside.
The confluence between the highs of the June range coinciding with the 100 MA (blue line) on the 4-hour chart has been used by sellers and should be used again by short sellers. Buyers can enter at the $69.00 handle with tight stops below $67.00 for an attempt at a return to either the middle of the range on the 4-hour chart or try again for a retest at the highs. However, given the downtrend this should not be attempted without some good news for Litecoin or crypto-assets in general.
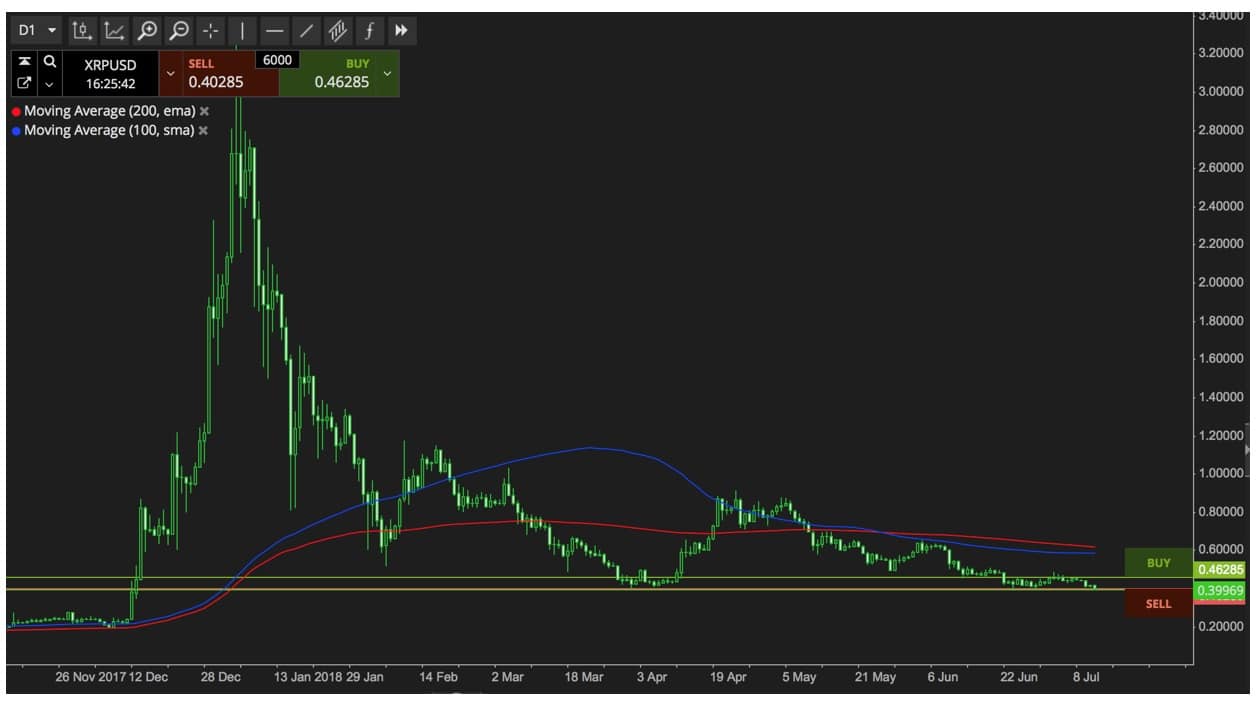
Zooming out on the Daily Ripple chart shows that price is approaching the low for the year in the $0.3996 region. If price were to drop down further it would hit the large daily supply level which supplied the price rally in December 2017. Traders looking to go long would see a good supply level and excellent value just above $0.2000 and stops could be placed just underneath December 2017 lows at sub 0.16000.

Financemagnates.com is author of this content, TheBitcoinNews.com is is not responsible for the content of external sites.
Our Social Networks: Facebook Instagram Pinterest Reddit Telegram Twitter Youtube


