


Bitcoin price is trading up 3% so far this week at $5458, despite being down from the yearly highs of $5627 achieved on Tuesday. As we march towards the weekend, let’s take a closer look at what’s going on in the markets.
4-Hour Chart
The 4-hour bitcoin price chart shows that BTC/USD 00 has established a range high for the week, month and year, which remains in close proximity to current price action.
Despite a selloff yesterday following a double top, bitcoin is currently showing signs of strength with a bullish hammer formed on the 4-hour chart, on top of the previous resistance of $5400; around middle of the trading range for the week.
Additionally, the MACD is printing higher lows on the histogram indicating that a bulish cross with the signal line is in the works as well as the MACD itself remaining positive.
Stoch RSI 4-Hour Bullish
In addition, BTC has a bullish cross on the 4-hour stoch RSI, which has led to higher prices and at least a retest of the top of the trading range, all of the way through April.
It stands to reason that Bitcoin will make another attempt to break $5600 on this metric along, with all previous Stoch RSI crosses leading to around a 5% increase in price. Should this pattern fail to repeat, the weekly low of $5250 will be the next line of support.
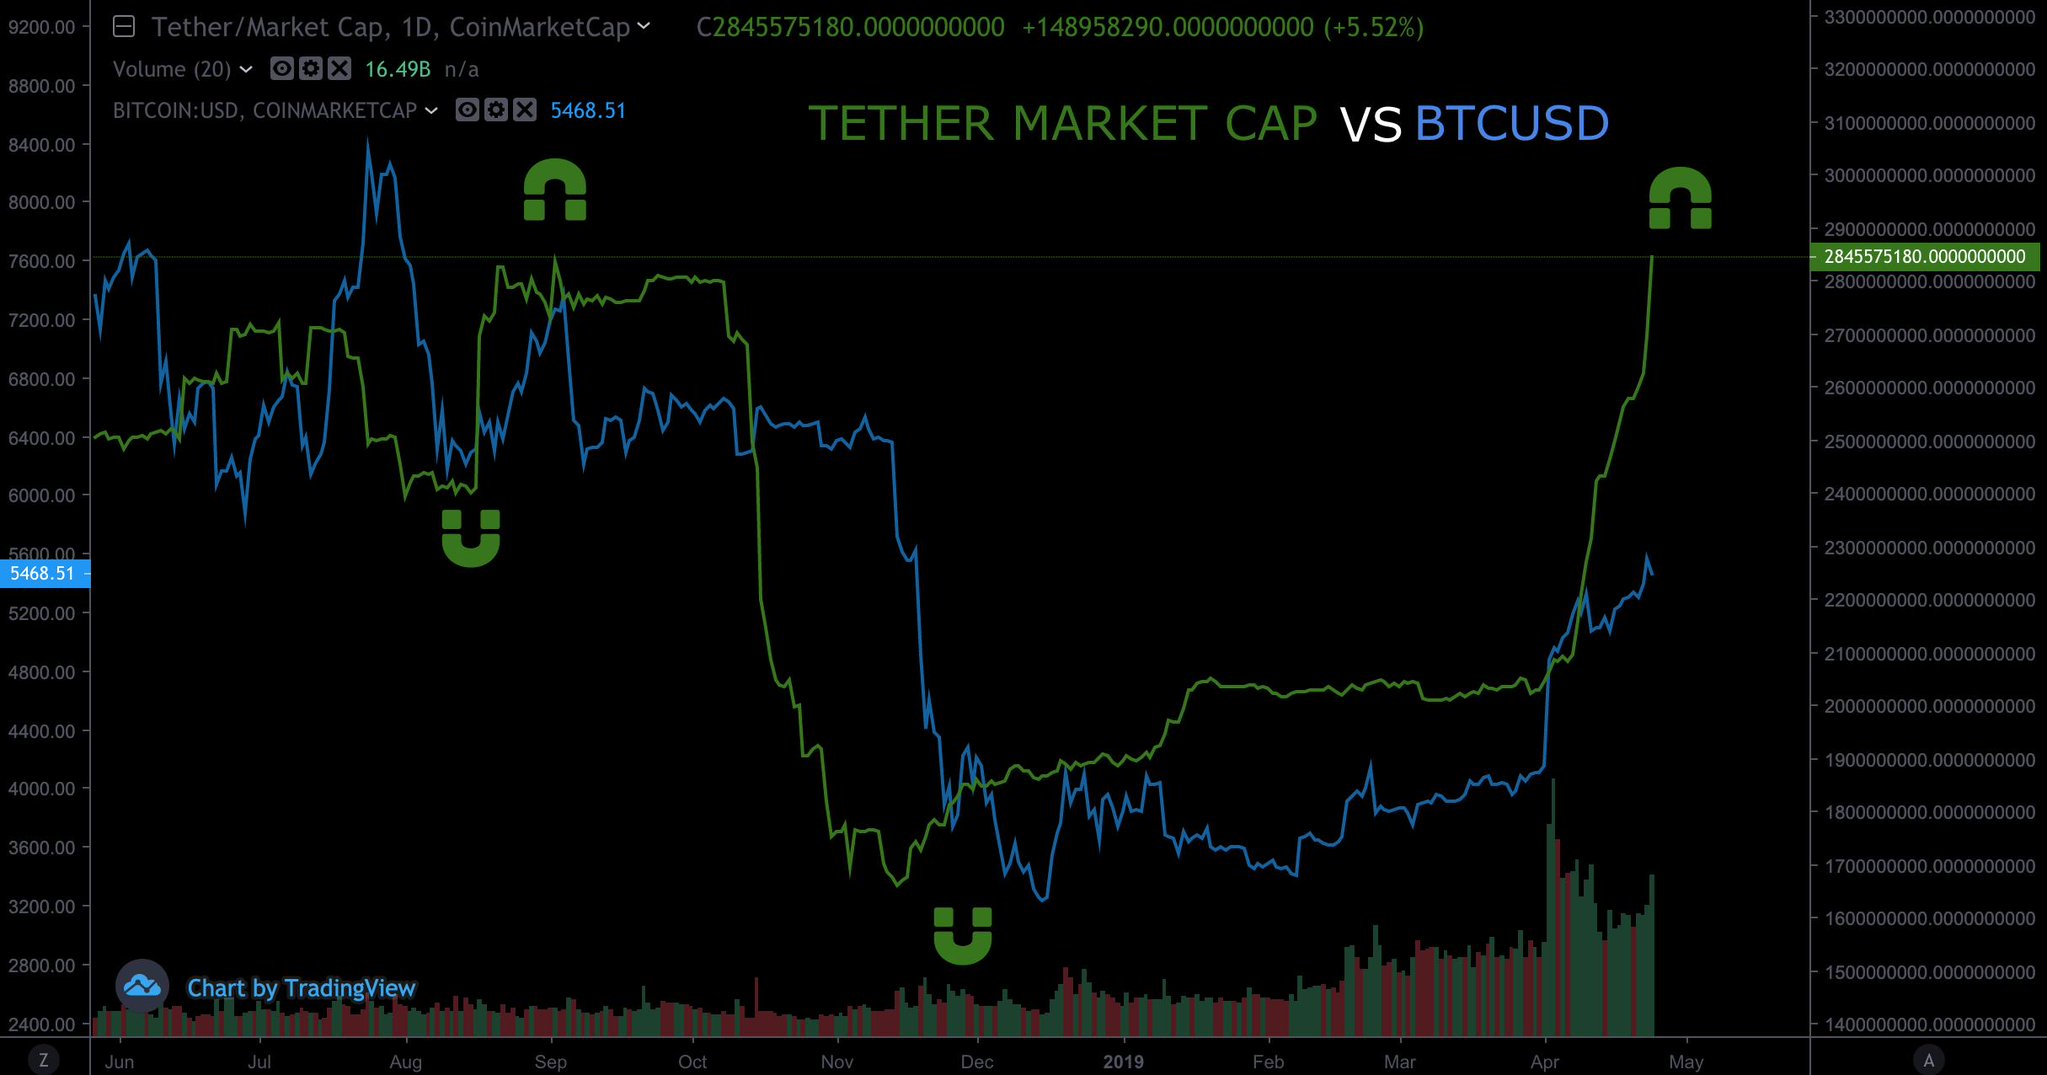
$300 Million New Tethers
Yesterday an additional $300m USDT was minted at the Tether treasury. This has now taken the USDT market cap to an all-time high of $2.9 billion.
Looking at the below correlation between USDT market Cap and bitcoin price, it is evident that there is a very strong correlation in recent times between the two.
A move in USDT typically precedes the price move in BTC. This is what would be expected on the basis that USDT gives a relatively transparent picture of demand in the market place, with an increase in USDT representing demand for cryptocurrency.
Bitfinex Short Positions
The number of shorts in the BTC market is now at 26k, whereas the longs are down at 22k. This implies that the bears are increasingly confident that price is due for a correction. However, the attempts to push the market lower have failed to go beyond a small correction so far.
The ratio of Longs-to-Shorts is now at its low point for the year. Should the shorts feel the heat from the new injection of USDT into the market, it could lead to a powerful move to the upside.
Another Attempt At $5600 Imminent?
In summary, it seems likely that the price of bitcoin will make another attempt to break $5600 based on trend analysis. However, conversely, the daily picture shows bearish divergences and that this move is running out of steam.
Meanwhile, the injection of tethers into the market alongside the recent golden cross pattern that appeared for the first time since the 2015 bottom are positive signs for the bulls. In whole, this may be indicative of more upside in the coming months irrespective of any immediate technical downside risk.
Trade Bitcoin (BTC), Litecoin (LTC) and other cryptocurrencies on online Bitcoin forex broker platform evolve.markets.
To get receive updates for the writer you can follow on Twitter (@filbfilb) and TradingView.
The views and opinions of the writer should not be misconstrued as financial advice. For disclosure, the writer holds Bitcoin at the time of writing.
Images courtesy of Shutterstock, Tradingview.com
The post Bitcoin Price: 5 Technical Bullish Signals Emerge For BTC/USD appeared first on Bitcoinist.com.

Bitcoinist.com is author of this content, TheBitcoinNews.com is is not responsible for the content of external sites.
Our Social Networks: Facebook Instagram Pinterest Reddit Telegram Twitter Youtube


