


Over the last 3 to 4 Days Bitcoin has been trading between $10,400 and $11,000 after the recent breakout of the descending channel on the 18th of July, as shown in my previous analysis. Traders are anxiously awaiting a decision as BTC continues within a tight trading range.
Bitcoin Price Analysis 4 Hour Chart
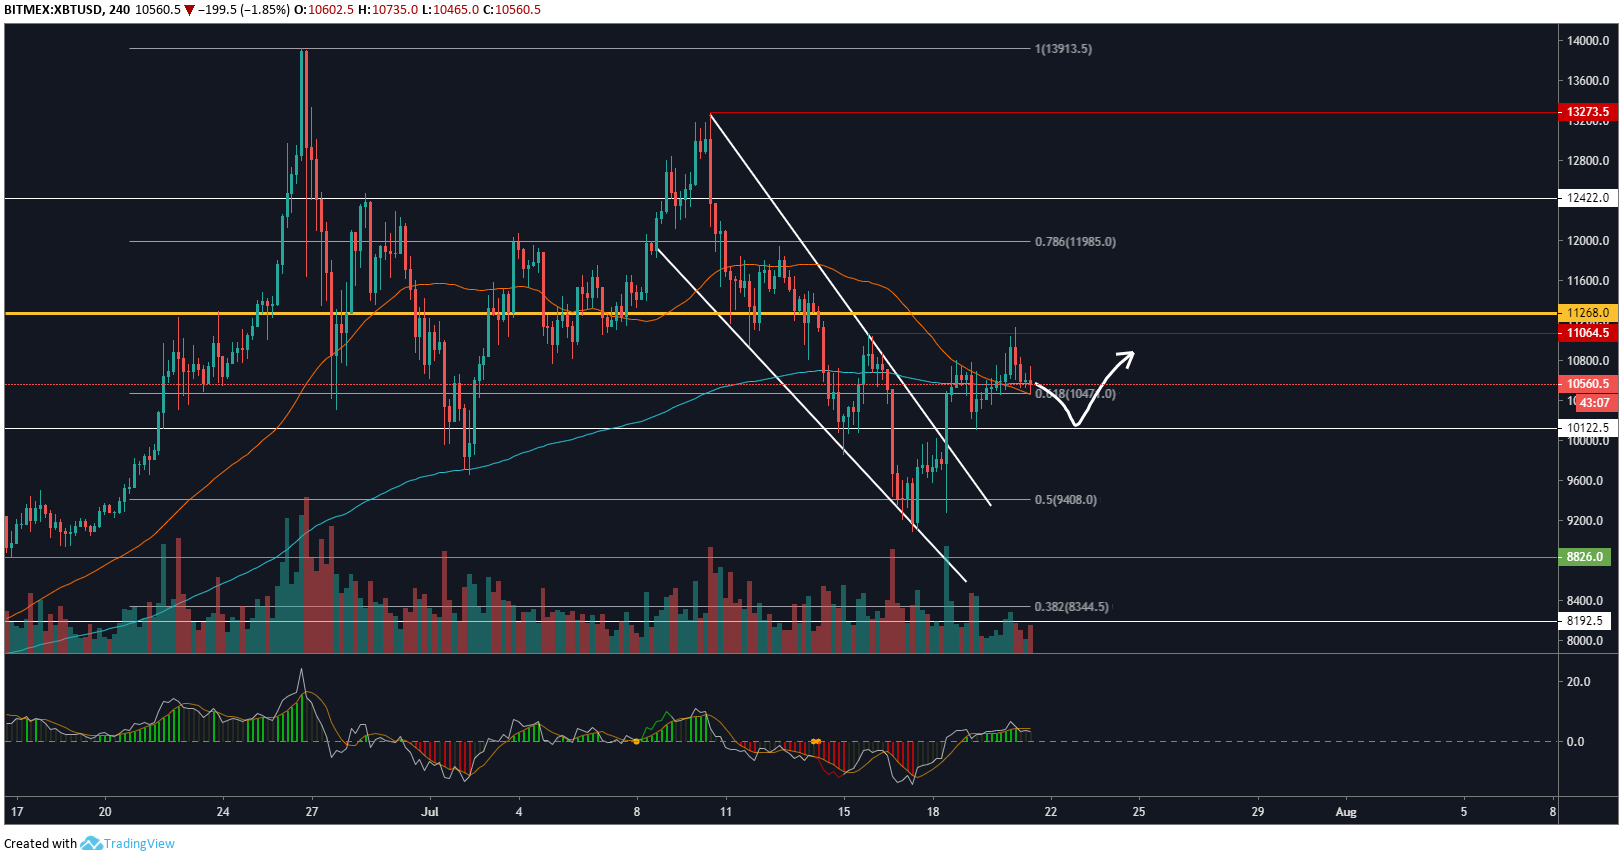
On the 4 Hour chart, we can see how Bitcoin price is developing since the breakout point on the 18th of July. It’s no surprise that throughout this weekend volume has been low, and as a result the price action has been trading within a tight range. Maxx Momentum indicator, which is very similar to the MACD indicator, has now convincingly crossed to the upside despite the low volume. This indicates that bulls are back in control for now.
Monday will be an extremely important day as this is typically when volume rushes back into the market and consolidation throughout the weekend comes to an end. This usually results in a big move which sets the tone for the rest of the week. We should expect to see a pull-back to key support at $10,100 before a continuation of the bullish trend. There’s an expectation of bullish continuation due to the breakout of the descending channel. More information on what to expect during a typical Monday’s trading session can be found here.
For now, it seems no matter what direction of how volatile/docile BTC’s price action is, altcoins are continuing to create lower lows resulting in little to no tradeable opportunities.
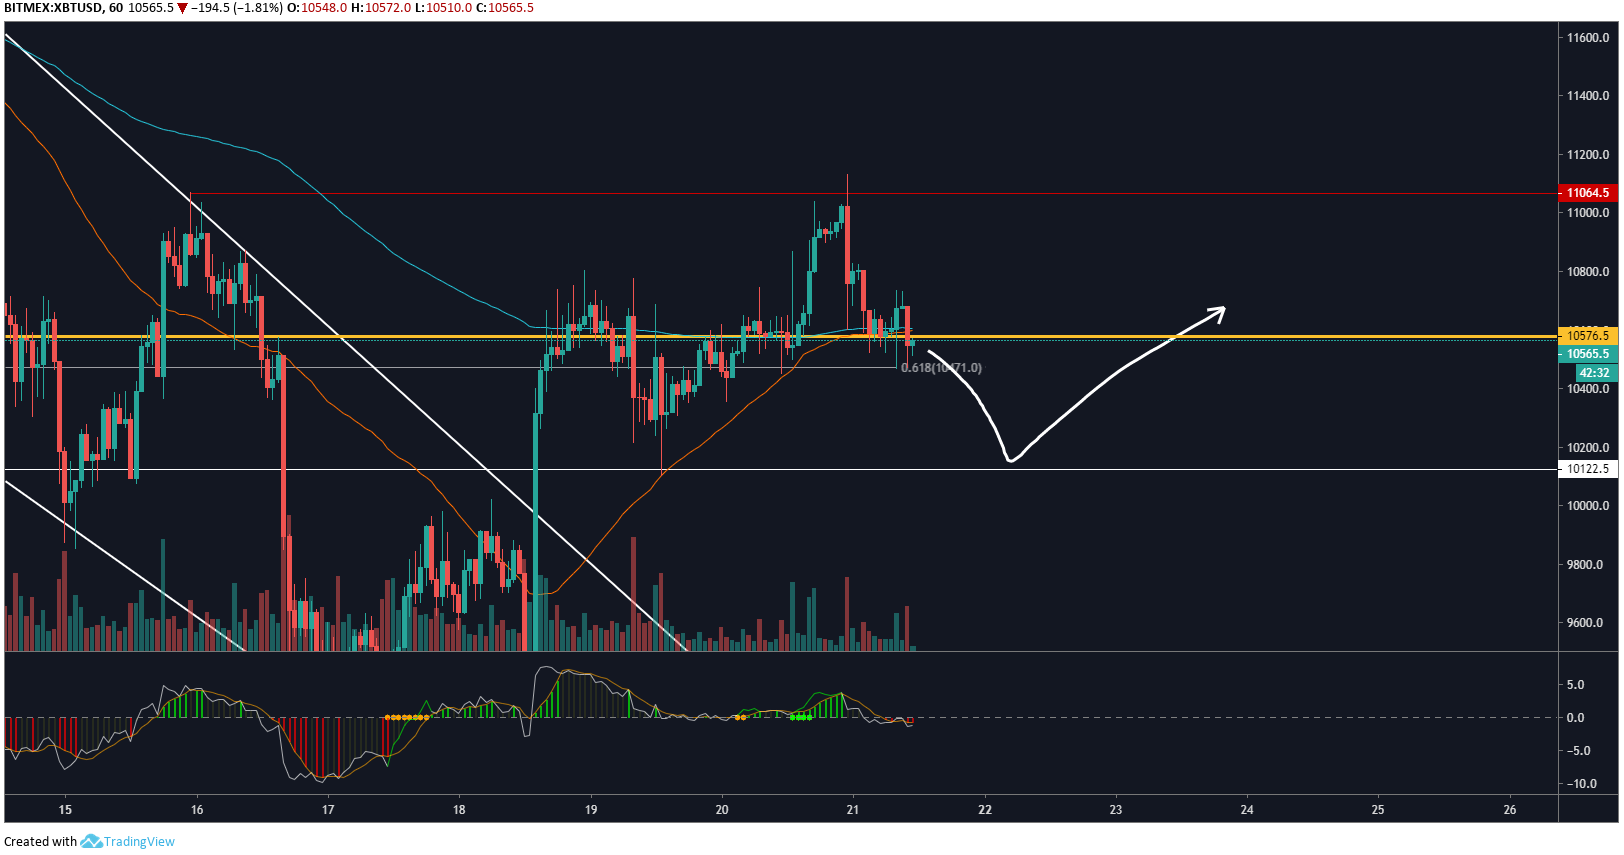
On the 1 Hour chart, we can see both the 50 MA and 200 EMA are moving extremely close to each other, which has been very uncommon throughout the last few months on BTC. This is usually a strong indication of suppression, and a big move ahead.
It’s quite hard to gauge which direction this will take Bitcoin price. The consensus and overall trend are still clearly bullish until key support at $8,800 is broken as mentioned in the previous analysis.
Maxx Momentum is trading very close to the median 0.0 line which aligns nicely with how close both the moving averages are trading in comparison to one another. Given this is all unfolding around the hourly POC at $10,500, this fills me with complete confidence that next week there will be a clear decision as to which direction BTC will be heading for the remainder of July.
Do you think BTC will break $14,000 before the end of Summer 2019? Please leave your thoughts in the comments below!
Images via Tradingview, Shutterstock
The post Bitcoin Price Analysis: $10,500 Holds Strong Despite Low Volume appeared first on Bitcoinist.com.

Bitcoinist.com is author of this content, TheBitcoinNews.com is is not responsible for the content of external sites.
Our Social Networks: Facebook Instagram Pinterest Reddit Telegram Twitter Youtube


