


Bitcoin bears have upped their assault in the last hour, driving BTC price down $200 on to the $7,700 support below. Can bulls defend against the mounting selling pressure, or will the asset continue unraveling inside the falling wedge pattern? Let’s take a look.
Bitcoin Price Analysis 4-Hour Chart
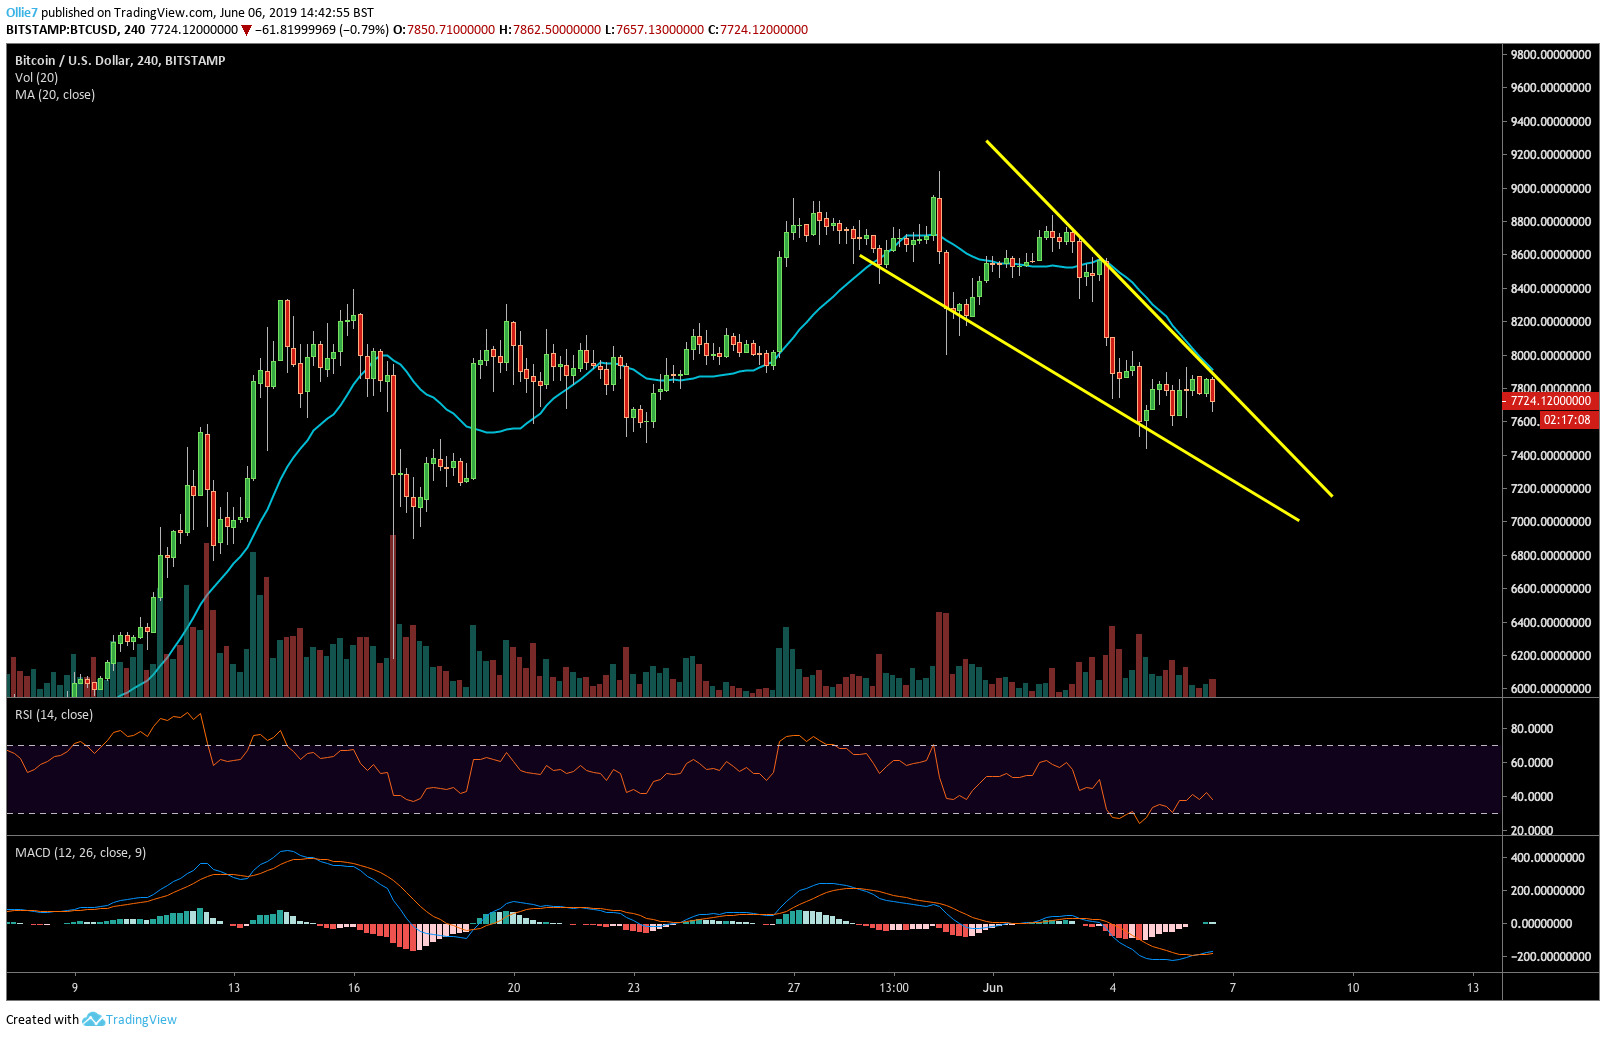
On the 4-Hour BTC/USD chart, we can see that bitcoin price 00 by market cap is still tracking well inside the falling wedge pattern we identified in yesterday’s analysis, having just ricocheted off the downtrending resistance.
This is the 3rd time that we’ve seen BTC bulls capitulate against the strong trend line, and suggests that market sentiment may be beginning to turn favorably bearish.
On the MACD we can see that the bullish convergence between the 12 and 26 moving averages is starting to show signs of weakness, with decreasing buying volume appearing on the histogram. The RSI has also failed to print a higher high over the last 4-hour candle as selling momentum picks up.
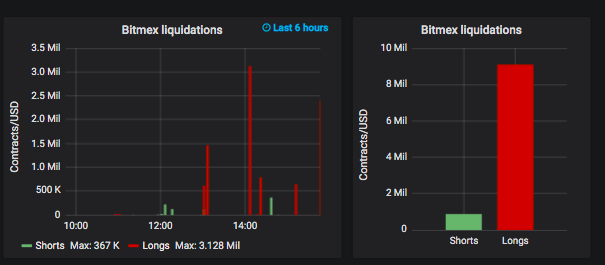
According to Bitmex chart information from Datamish, there has also been a sudden $7 million liquidation of Bitcoin long positions in the last 2 hours (see below), which tells us that derivative traders could also be anticipating BTC to continue declining. This will likely be placing additional pressure on Bitcoin bulls right now, and could very well extend BTC’s intraday losses.
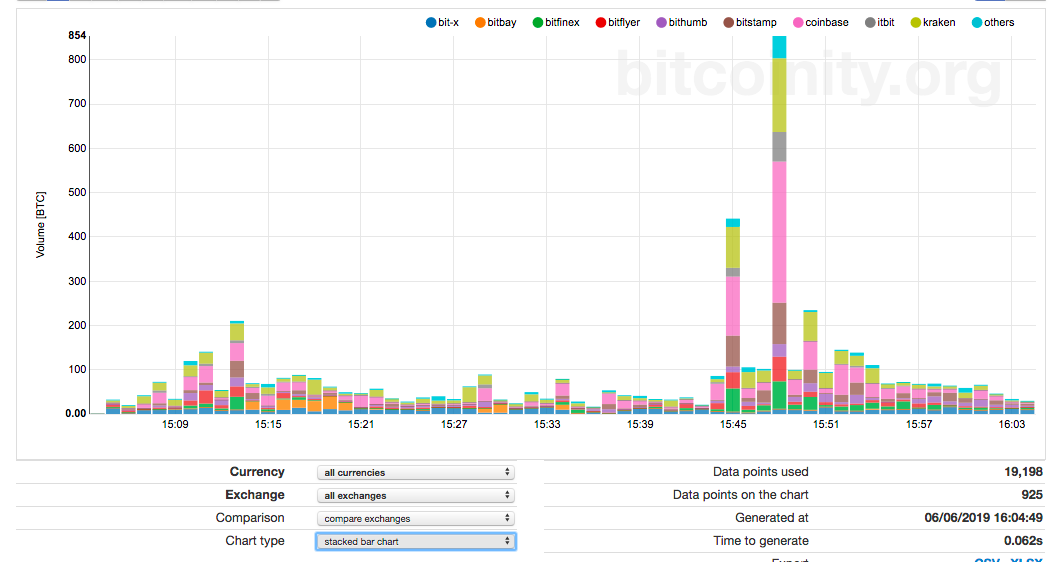
There was also a noticeable spike in Bitcoin trading volume across a range of leading exchanges at 15:48 (UTC+1), as recorded by Data.Bitcoinity.org, which caused BTC to briefly crash below $7,600. This is likely due to auto-bot trades getting triggered as BTC passed below the $7,650 level.
2-Hour Chart
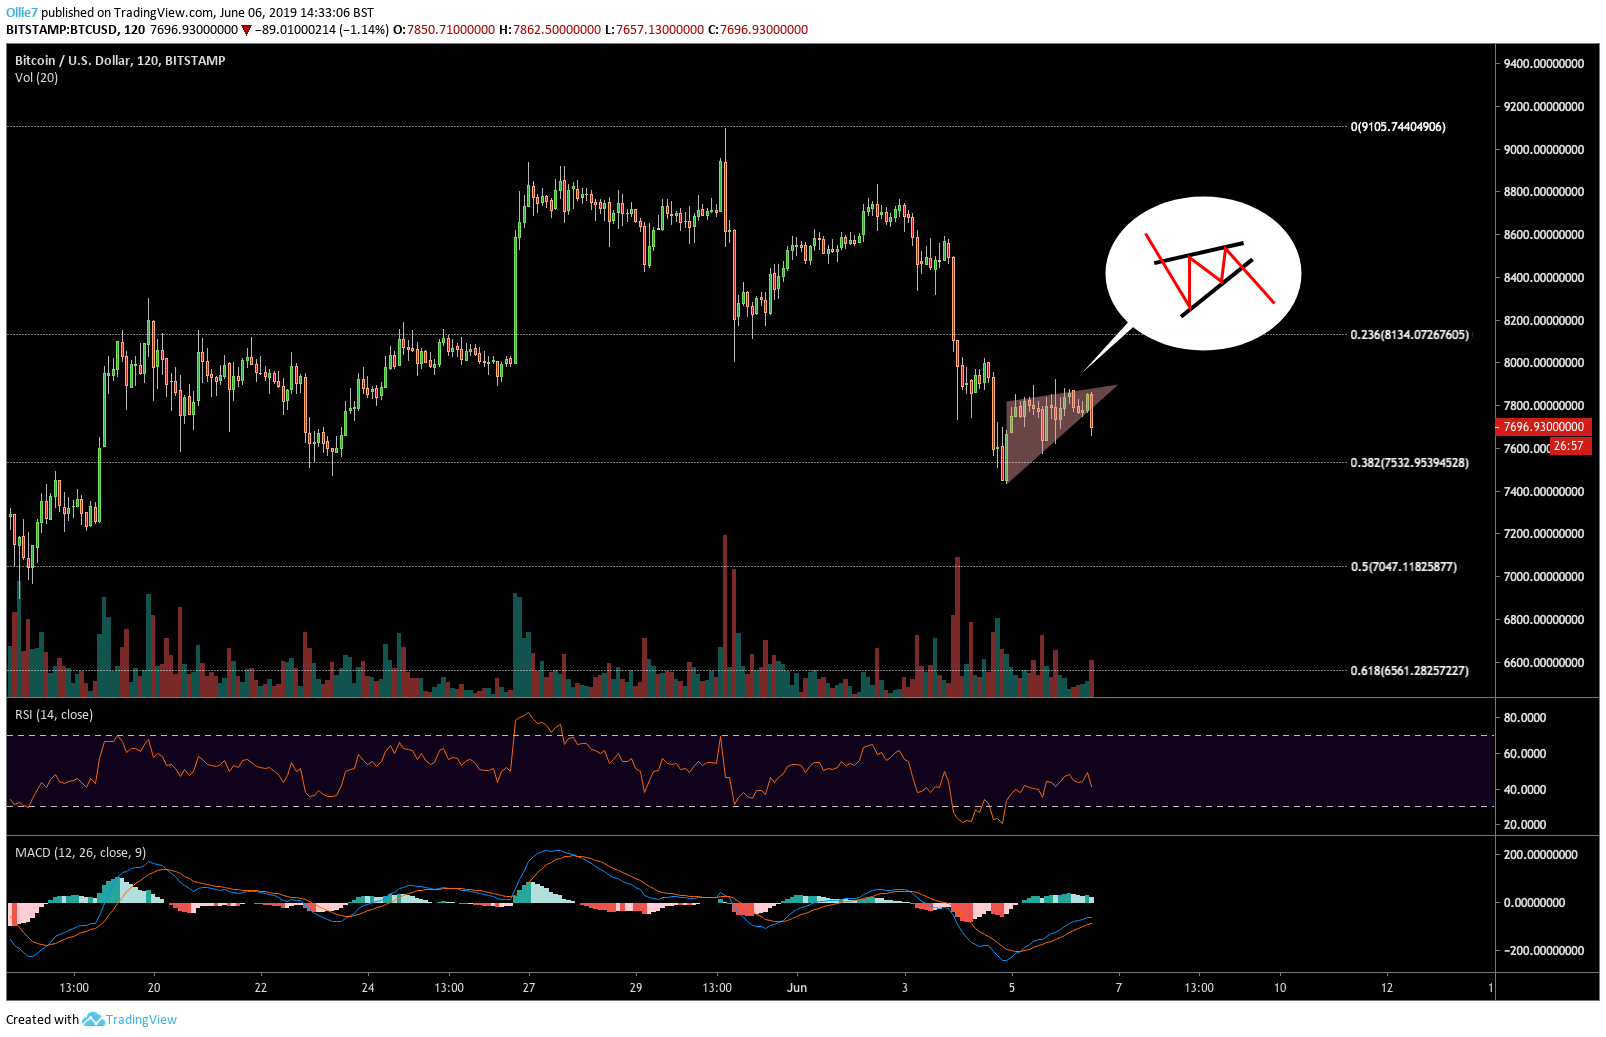
Looking at the recent price action more closely, we can see that BTC/USD actually broke out bearish out of a rising wedge continuation pattern that it had been oscillating in for the last 24 hours.
These patterns are characterized by an uptrending support and resistance level which eventually meet into a point. The price consolidates between these two levels until buyers eventually become exhausted, and bears overpower the support.
We can usually predict the breakout target for these patterns by measuring the distance between the opening swing low and high of the pattern, and projecting that distance on to the breakout candle. If we do this, we are given the $7,500 level exactly.

This psychological support is likely to give bullish traders an opportunity to pushback against the downtrend, but it seems unlikely that BTC will be able to break out of the falling wedge in the short-term.
The next strong support for Bitcoin appears to sit around the $7,250 area, where the price action is most likely to meet with the downtrending support of the wedge pattern.
Where is bitcoin price headed next? Share your predictions below!
Images via Tradingview.com, Shutterstock
The post Bitcoin Price Analysis: $7,700 Support Under Treat in Falling Wedge appeared first on Bitcoinist.com.

Bitcoinist.com is author of this content, TheBitcoinNews.com is is not responsible for the content of external sites.
Our Social Networks: Facebook Instagram Pinterest Reddit Telegram Twitter Youtube


