


The Bitcoin FOMO rally is truly underway, as the #1 cryptocurrency extends its meteoric rise by a further 9.4% today. With so much momentum picking up behind asset, where are bullish traders going to take it next?
Bitcoin Daily Chart
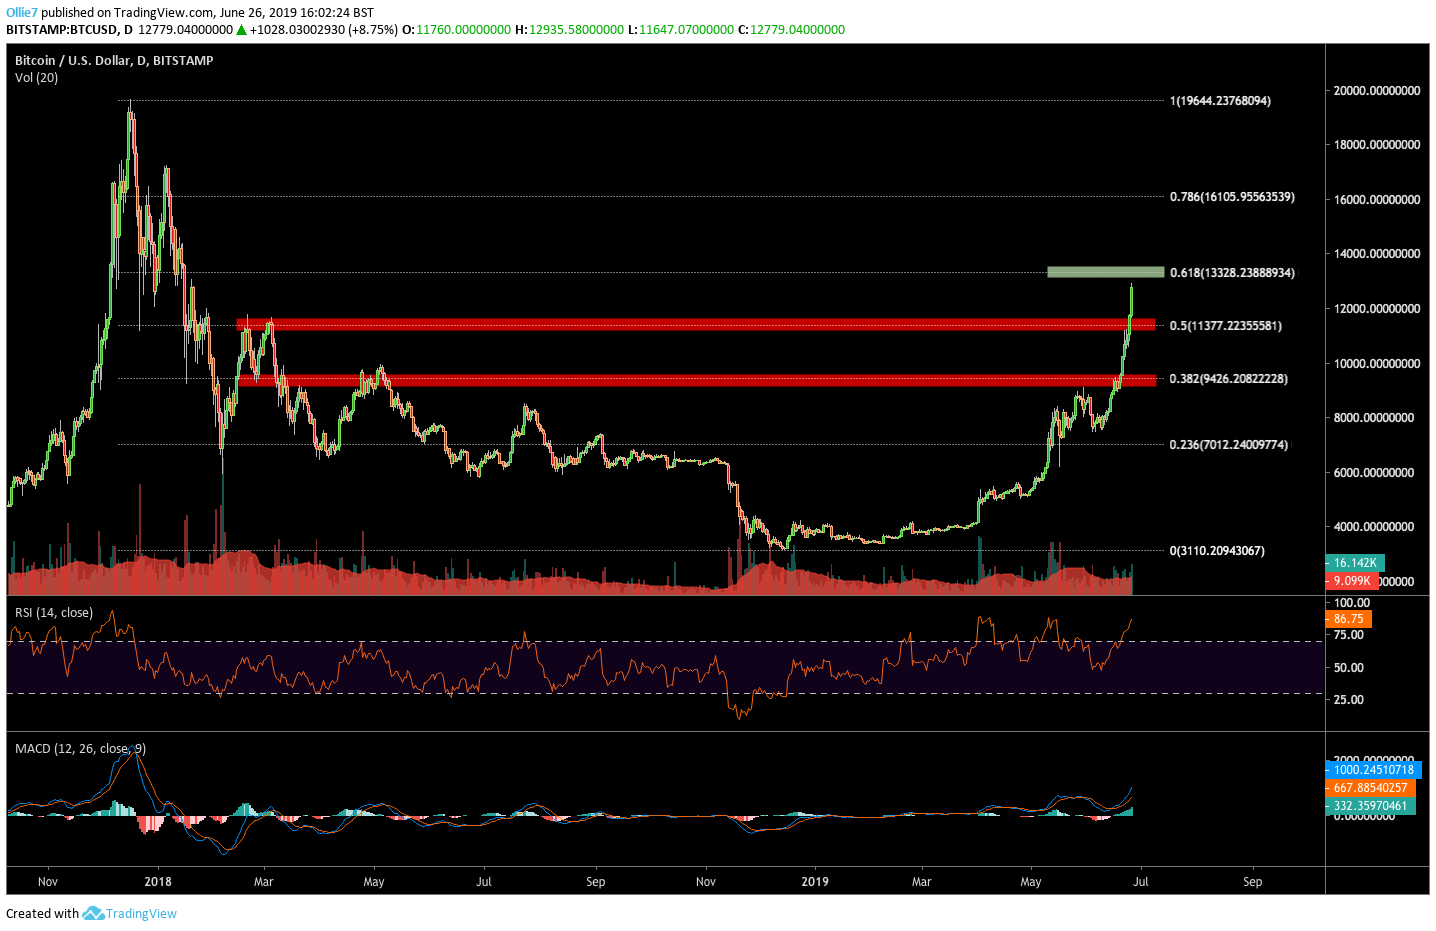
On the daily BTC/USD chart we can see that bitcoin price 00 is showing no signs of slowing down. Momentum on both the MACD and RSI indicators is continuing to skyrocket in typical bull market fashion, and buying volume is showing a marked increase as new investment piles in.
Today’s bullish continuation has, so far, added an extra $1,160 to bitcoin price, and set yet another new YTD-high of $12,935.
Right now, anticipated selling pressure at the psychological $13,000 mark is creating temporary friction in the uptrend, however at this stage it appears more than likely that this wall will be overcome before the daily close.
So where is Bitcoin heading next?
Over the last 2 weeks, bitcoin price has been met with notable selling pressure at the 0.382 and 0.5 fibonacci levels ( $9,426 and 11,377 respectively). This suggests that a vast number of investors are trading around these key levels, particularly after bitcoin’s breakout above $7,000.
Between May 30 and June 13, BTC bulls were forced to capitulate down on to $7,600 support, after failing to break above the 0.382 fibonacci level during the opening test. After a short period of accumulation however, a new impulse movement was launched which saw bitcoin break confidently through the fabled $10,000.
Between June 22-23, the next fibonacci level (0.5) created some problems in the uptrend again, but this time bullish traders were able to quickly overpower it within 48hours.
From these two events we can identify two important things;
(1) The next area where we should expect to see some selling pressure will more than likely to be around $13,328, at the 0.786 fibonacci level.
(2) BTC bulls are breaking through each new overhead resistance faster, which suggests that momentum is only growing stronger.
Short Traders Thinning Out
Now that this momentum has reached a point where bear traders are being shaken out, and key resistances are no longer creating pushbacks, it’s incredibly likely that the only price point where we’ll see any real bearish opposition will be at bitcoin’s all-time high at $20,000.
According to information from Datamish, over $45 million in Bitmex BTC short positions have been liquidated in the last 6 hours (see below), and Binance has recently announced the first liquidation of a Bitcoin short on its new margin trading platform.
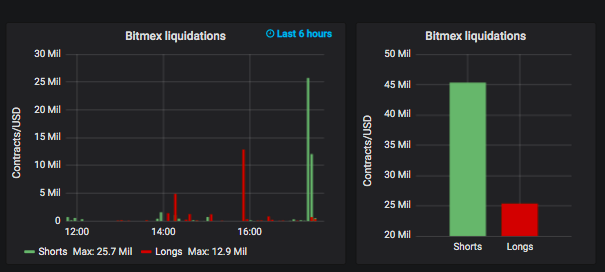
These liquidations will undoubtedly be adding more fuel to Bitcoin’s parabolic rise, as the #1 cryptocurrency continues to defy derivative trader expectations.
Do you think Bitcoin will break the new $13,328 target soon? Let us know your thoughts in the comment section below!
[Disclaimer: The views and opinions of the writer should not be misconstrued as financial advice. For disclosure, the writer holds Bitcoin at the time of writing.]
Images courtesy of Tradingview, Shutterstock
The post Bitcoin Price Analysis: BTC Bulls Eye $13.3K As Next Target appeared first on Bitcoinist.com.

Bitcoinist.com is author of this content, TheBitcoinNews.com is is not responsible for the content of external sites.
Our Social Networks: Facebook Instagram Pinterest Reddit Telegram Twitter Youtube


