


After much anticipation of an explosive move, Bitcoin has finally chosen a direction for the short-term dumping through the asymmetrical triangle support. Current market price rests on $8,100 support but looks poised to drop further.
Bitcoin 1-Hour Price Analysis
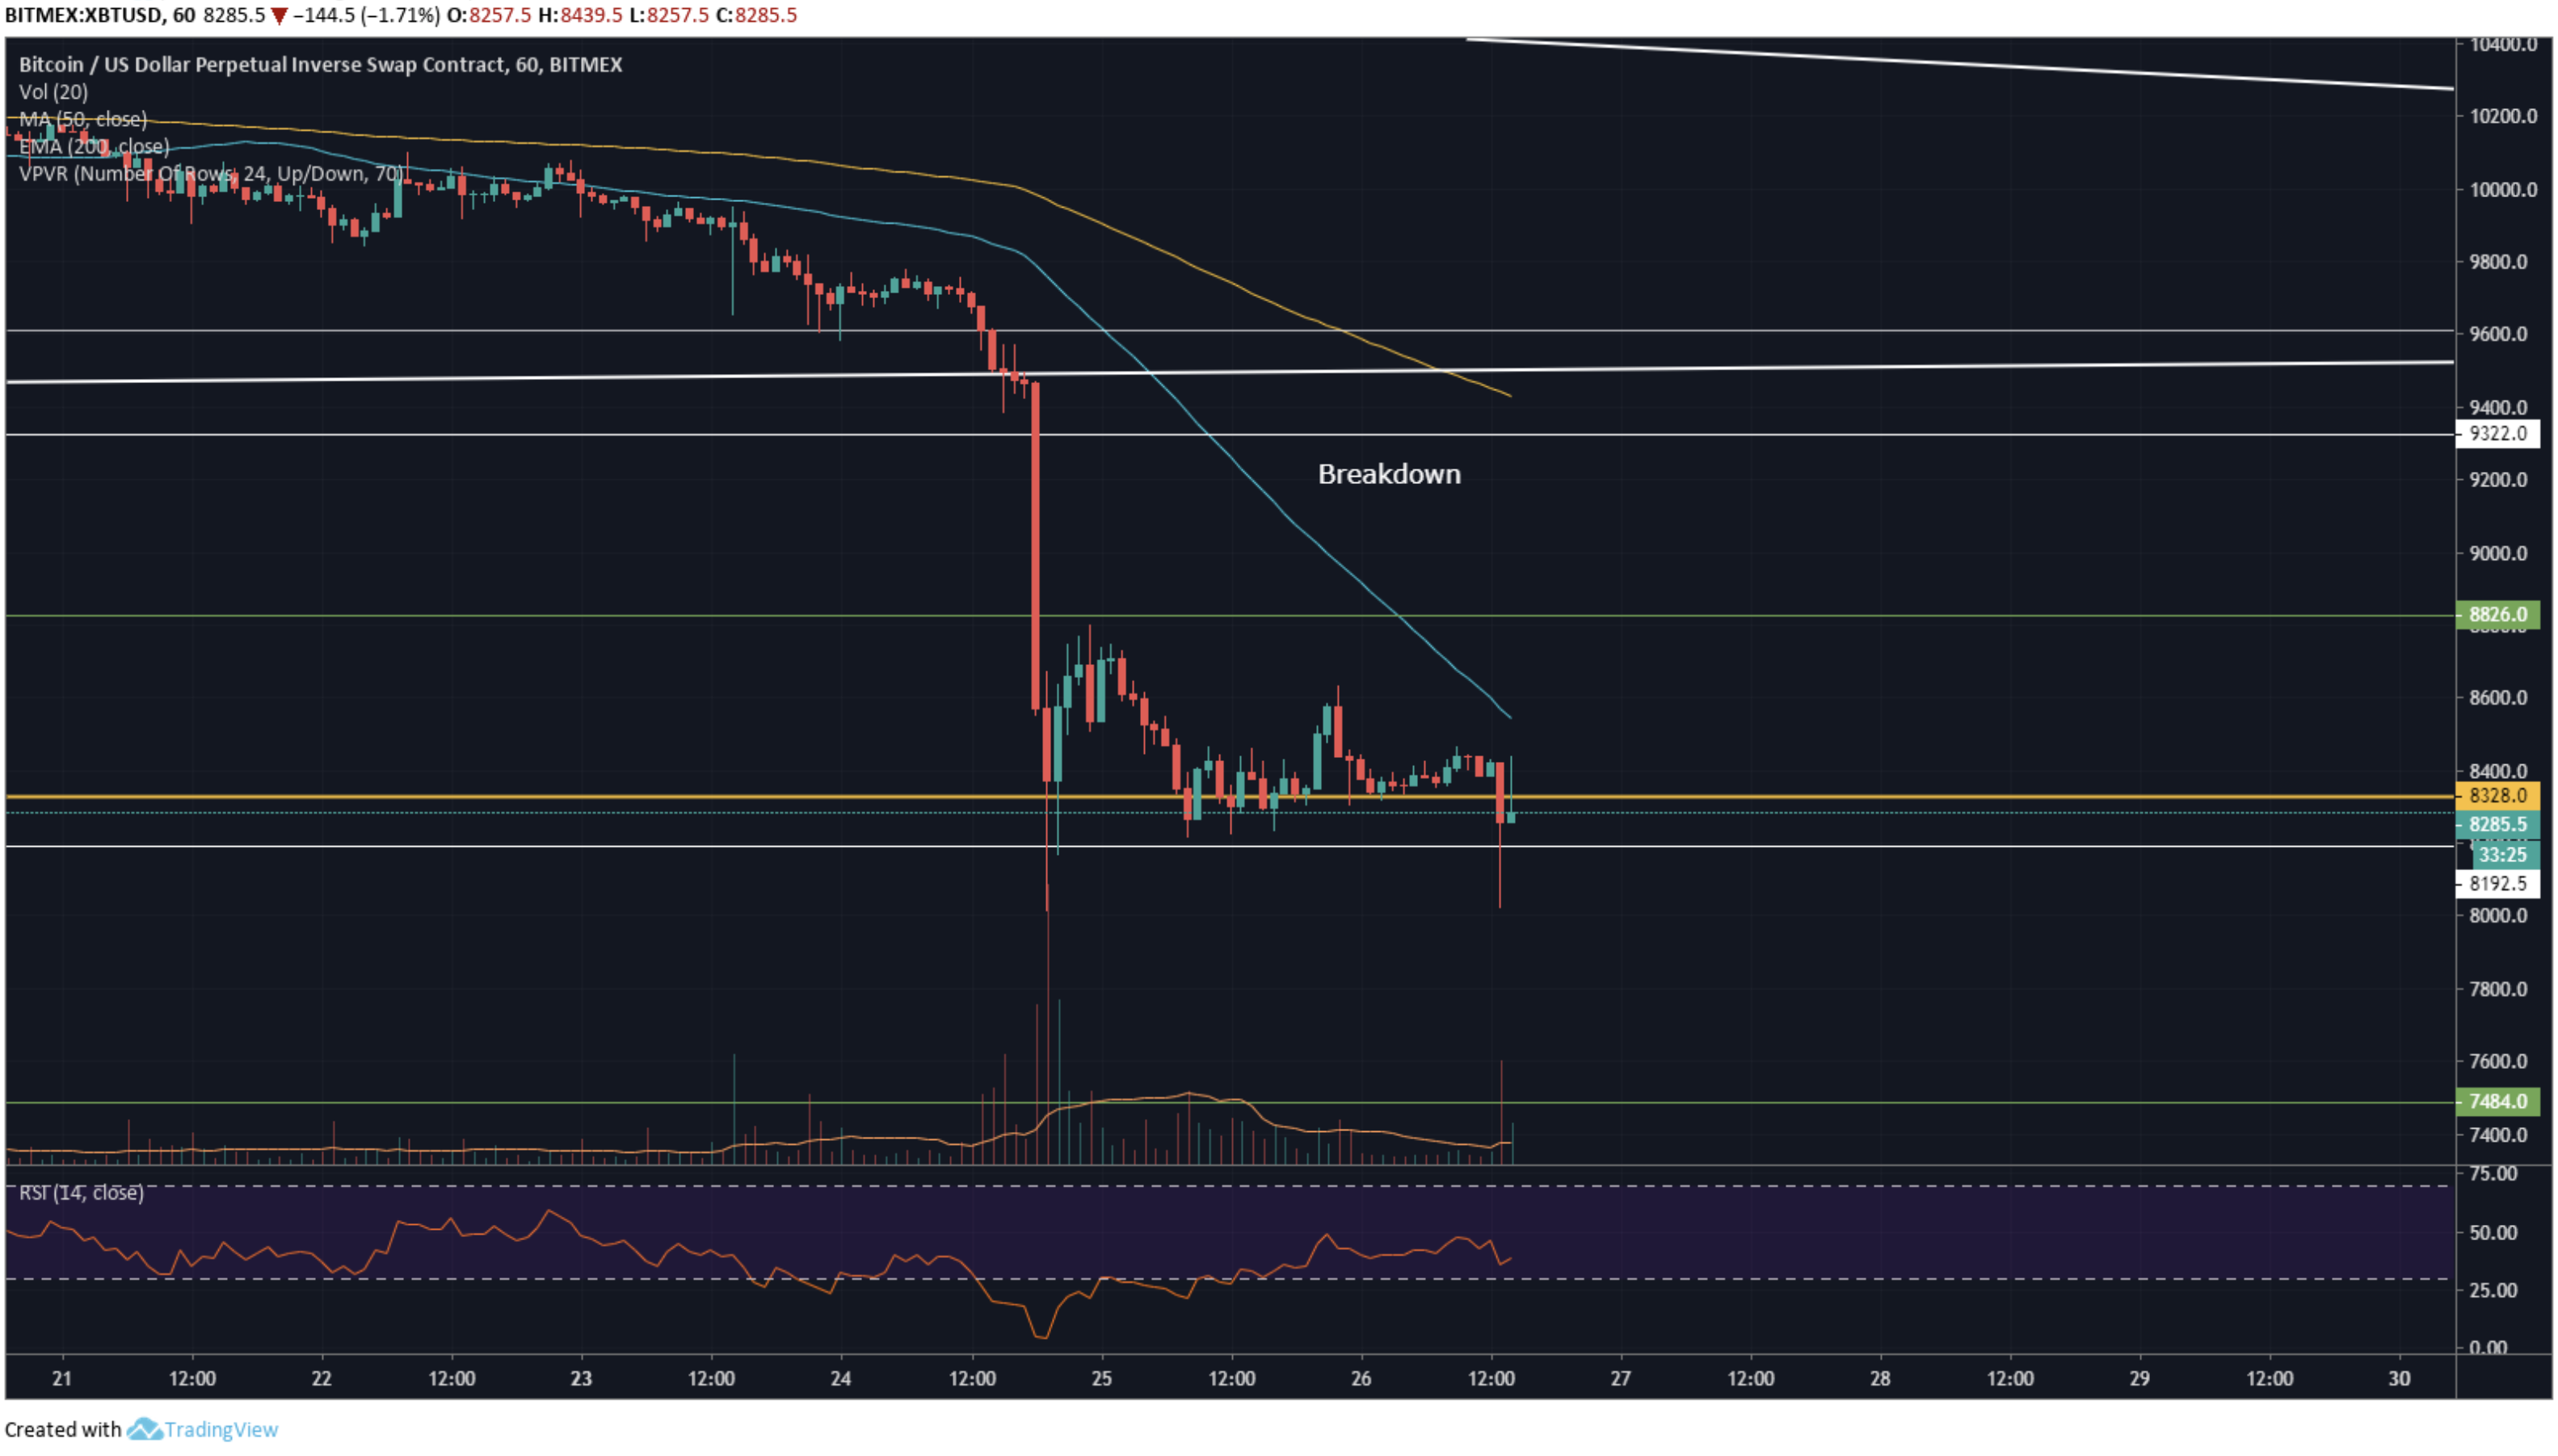
On the 1 hour chart for XBT/USD, we can see the recent break-down that has taken place. This movement resulted in price levels crashing through the larger asymmetrical triangle support clearly visible on the daily chart below. The current market price finds brief rest-bite as price levels find support at $8,100.
There doesn’t appear to be adequate buying pressure entering the market at $8,100 leading me to believe that Bitcoin will drop further to my predicted target of $7,200 as stated in my previous analysis on Bitcoin here.
POC (Point of Control) sits just above the current market price on the 1 hour indicating price action is going through a brief period of short-term consolidation. This will essentially result in price action trading sideways for a few days, and selling pressure gradually building up again ahead of another dump over the coming days. Key support lies between $7,400 and $7,150, and will likely be an area in which Bitcoin bounces and re-gains momentum to the upside.
1-Day Price Analysis
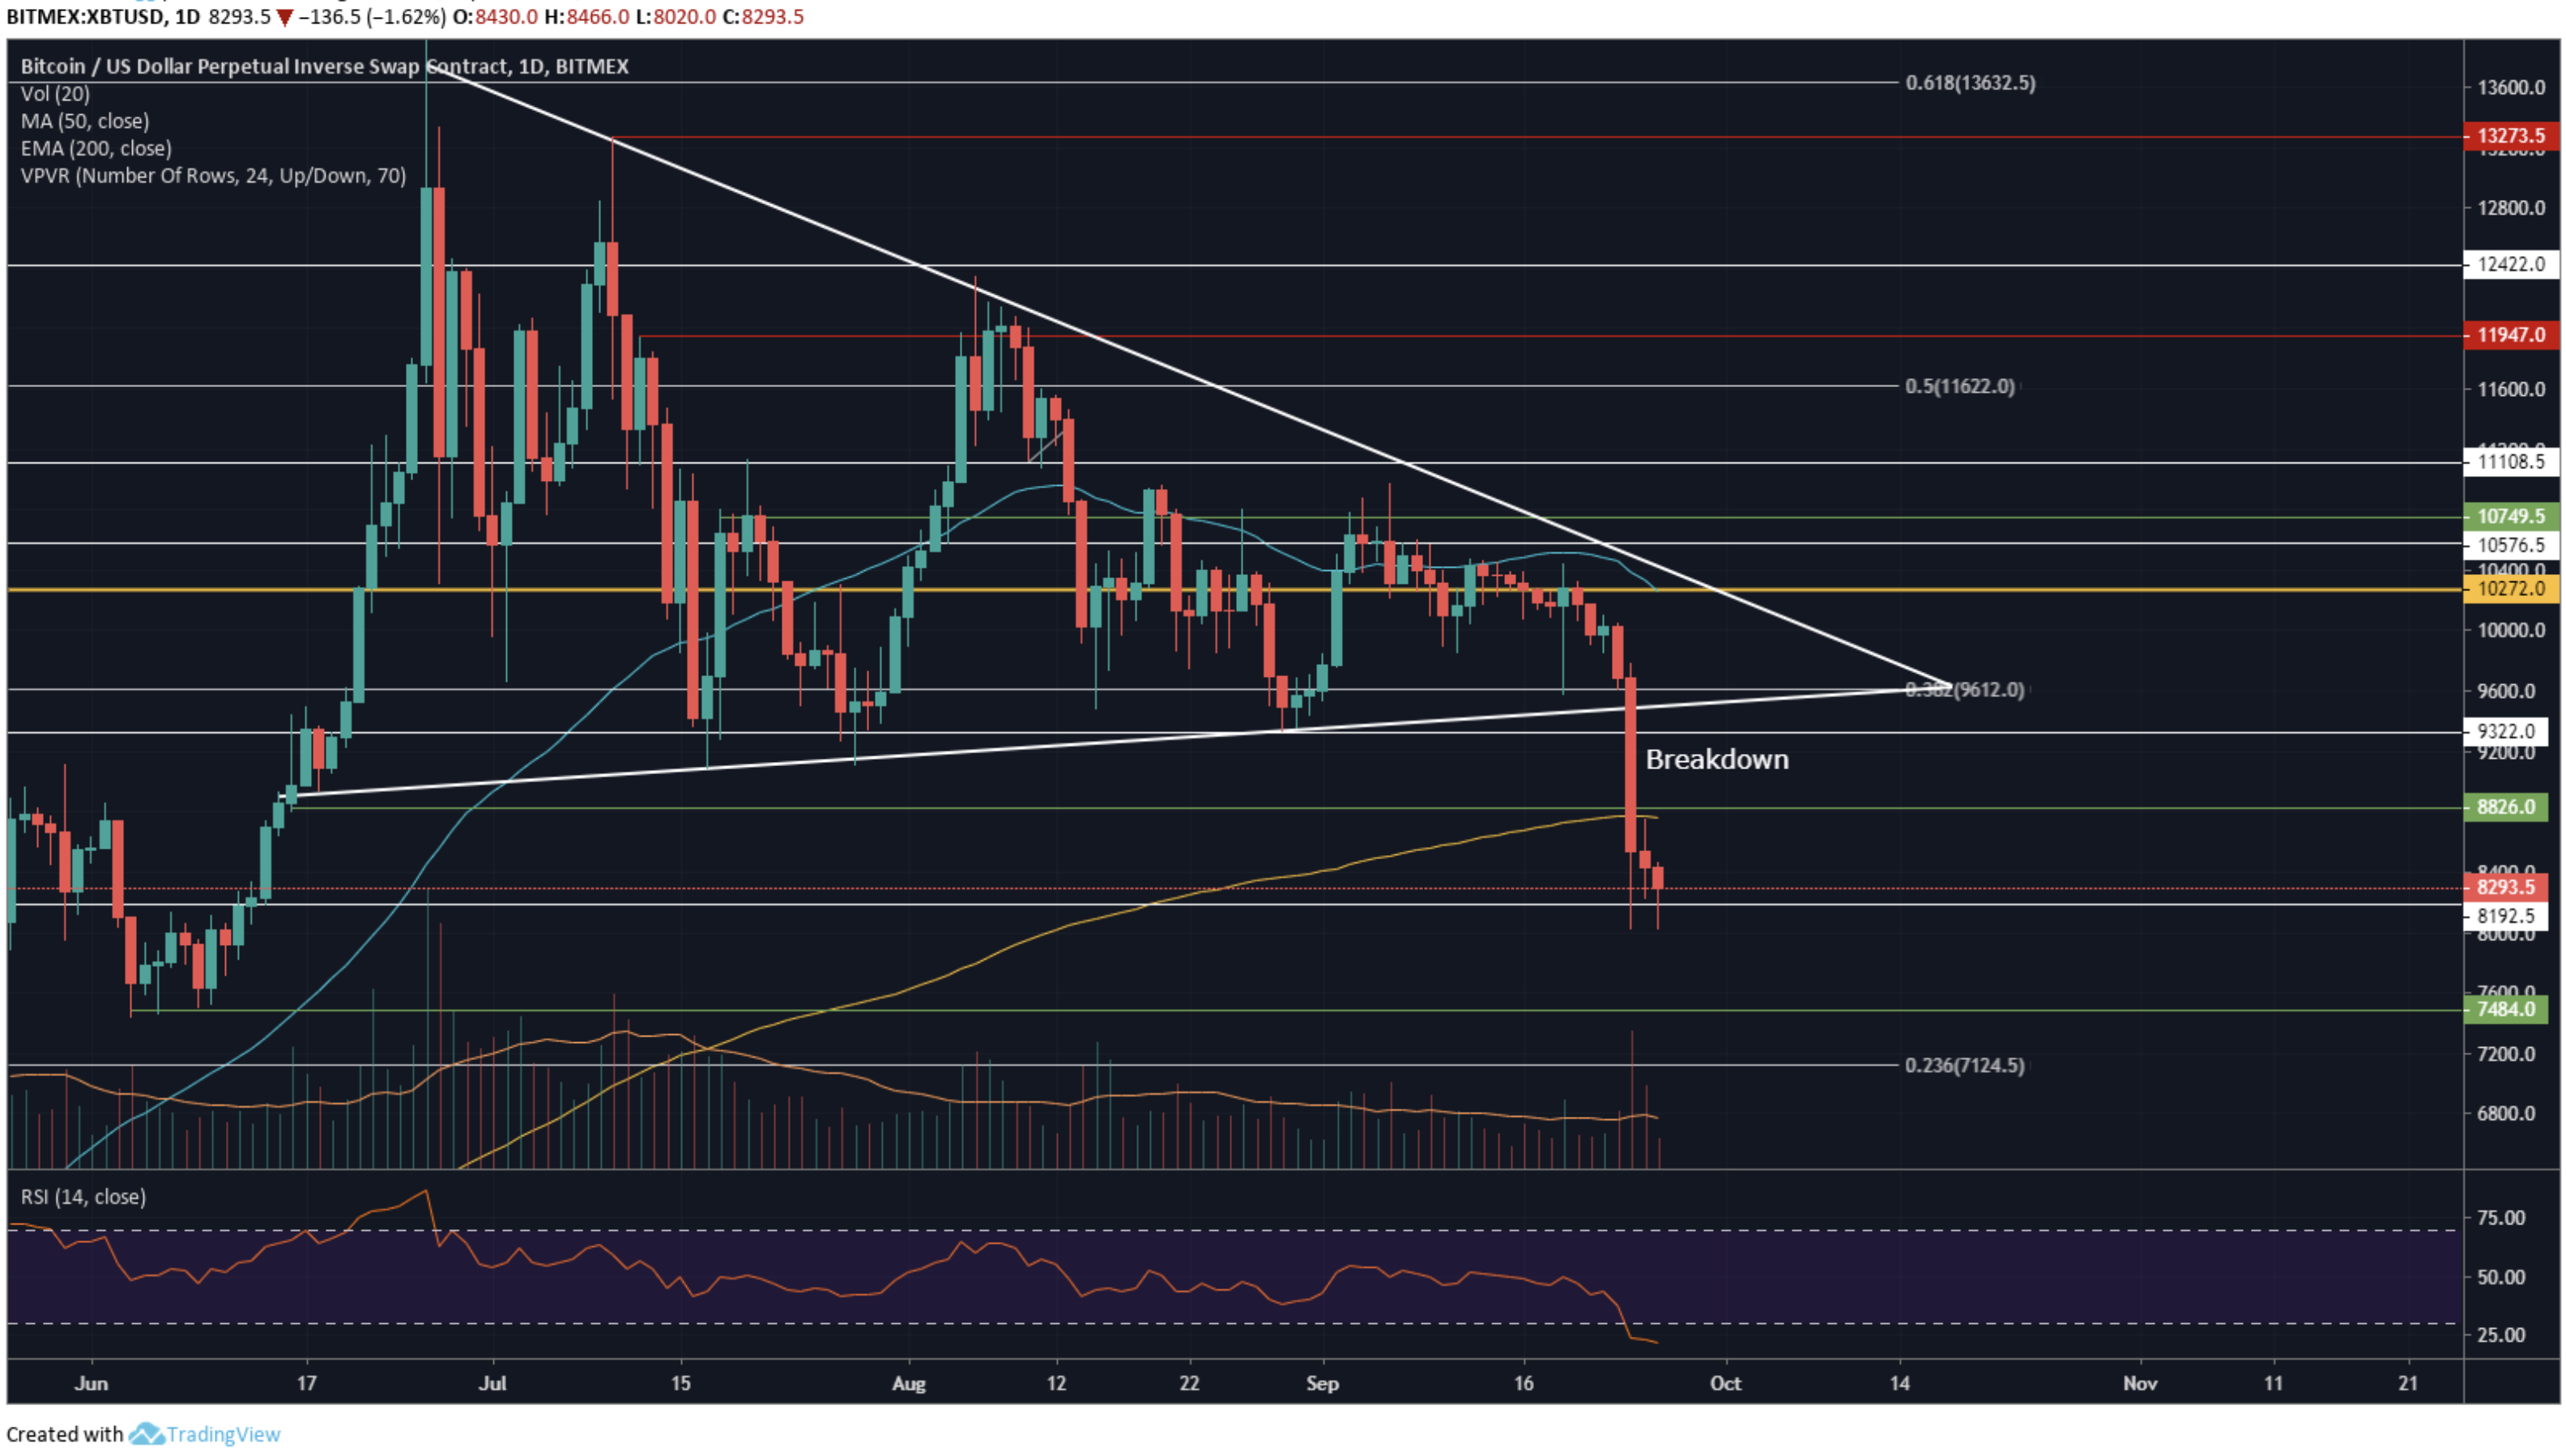
On the 1 day chart for XBT/USD, we can see the break-down through the asymmetrical triangle clearly. The breakdown took place at $9,400 and was fuelled by a large red volume candle. Current market price rests on a strong support line, however there doesn’t appear to be enough buying pressure as the most recent daily candle is still very much red in order to see any form of a bounce.
I’m anticipating another dump through $8,200 down to between $7,150 and $7,400 over the coming days. I will then be monitoring how price action behaves at this key support range to determine the likelihood of a bounce play. RSI has turned completely oversold on the daily chart for the first time in the last few months. This means if you’re looking to re-enter into Bitcoin you should be paying close attention over the coming weeks for an entry signal.
It’s crucial to practice proper risk management such as scaling into and out of the market, using sensible stop losses and not overtrading during times when selling volume is in control of Bitcoins short-term price action. We’ve all seen how brutal the affect of bearish pressure can be within a short time frame.
Do you think Bitcoin will drop to $7,200 before potentially bouncing? Please leave your thoughts in the comments below!
This article is strictly for educational purposes and isn’t to be construed as financial advice.
Images via Shutterstock, XBT/USD charts by Tradingview
The post Bitcoin Price Analysis: BTC Dumps To $8k As Market Trembles appeared first on Bitcoinist.com.

Bitcoinist.com is author of this content, TheBitcoinNews.com is is not responsible for the content of external sites.
Our Social Networks: Facebook Instagram Pinterest Reddit Telegram Twitter Youtube


