


Bitcoins price movements have been quite slow over the past few weeks as price action consolidates around the $10,000 mark. Volume remains low and price action looks poised for a drop below $9,000 over the coming days.
Bitcoin Price 1-Hour Analysis
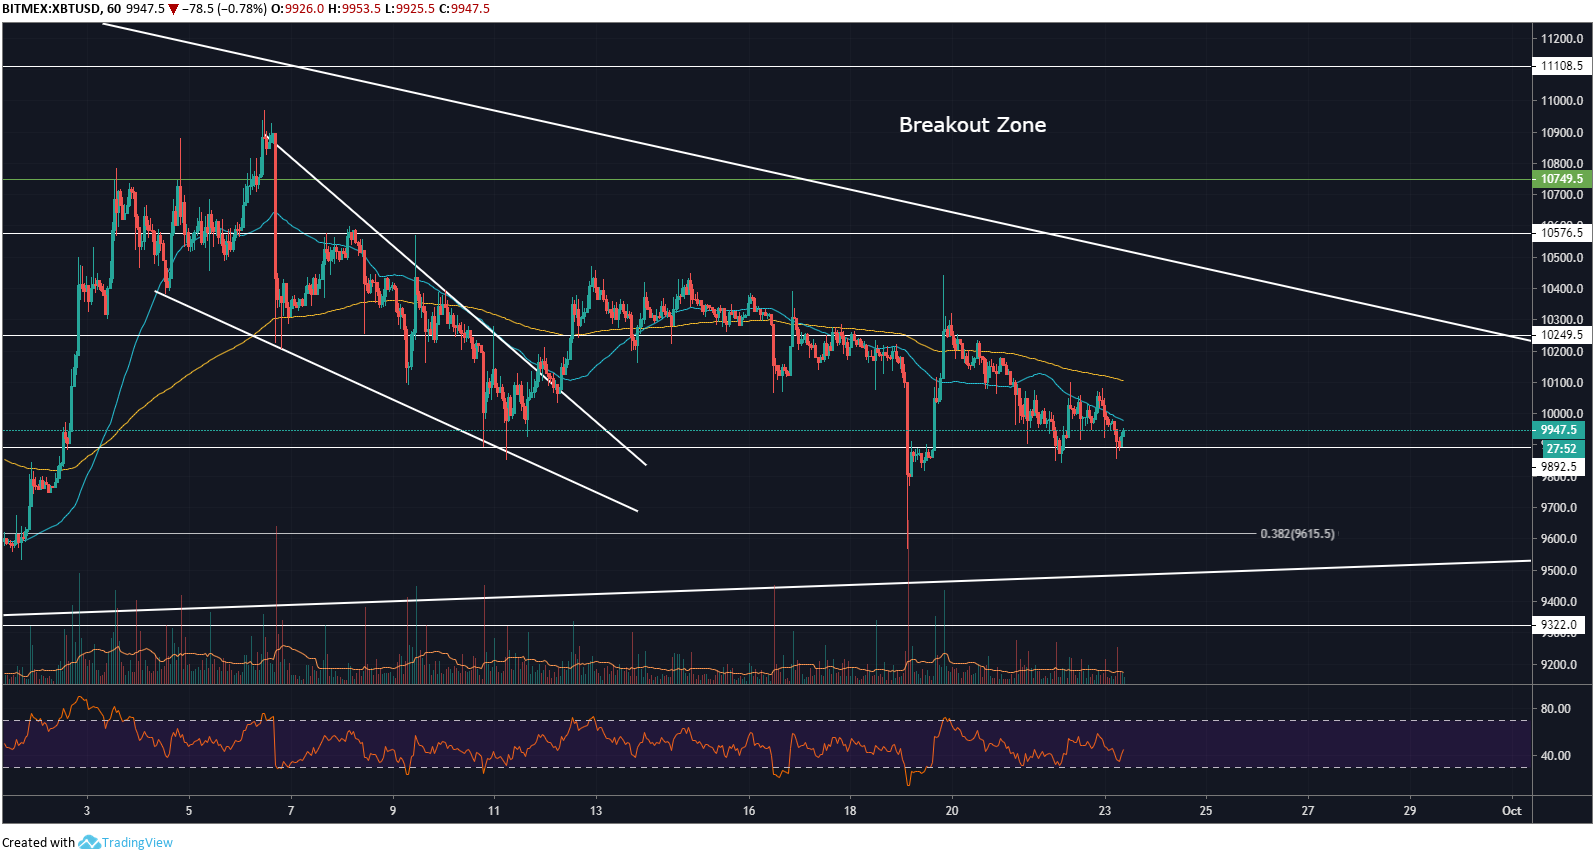
On the 1 hour chart for XBT/USD, we can see price action has been slowly falling after exiting the falling wedge that formed throughout the beginning of September, visible in my previous Bitcoin analysis. Price levels briefly dumped through support at $10,000 on the 19th of September but quickly turned around and created a higher high. This seems to indicate that volume levels are very low, and any volume spikes that do occur will have a very clear direct impact on short-term price action making trading the current chop very difficult.
Both the 50 MA and 200 EMA on the hourly chart have been moving extremely close to one another for the last two weeks. This shows that the current price action is going through a period of predominantly sideways consolidation. RSI currently sits around the 40.00 level and could turn in either direction. However, overall it’s likely that price levels will fall below $9,400 over the coming days or weeks dependant on how long the current period of consolidation lasts for.
Price Analysis
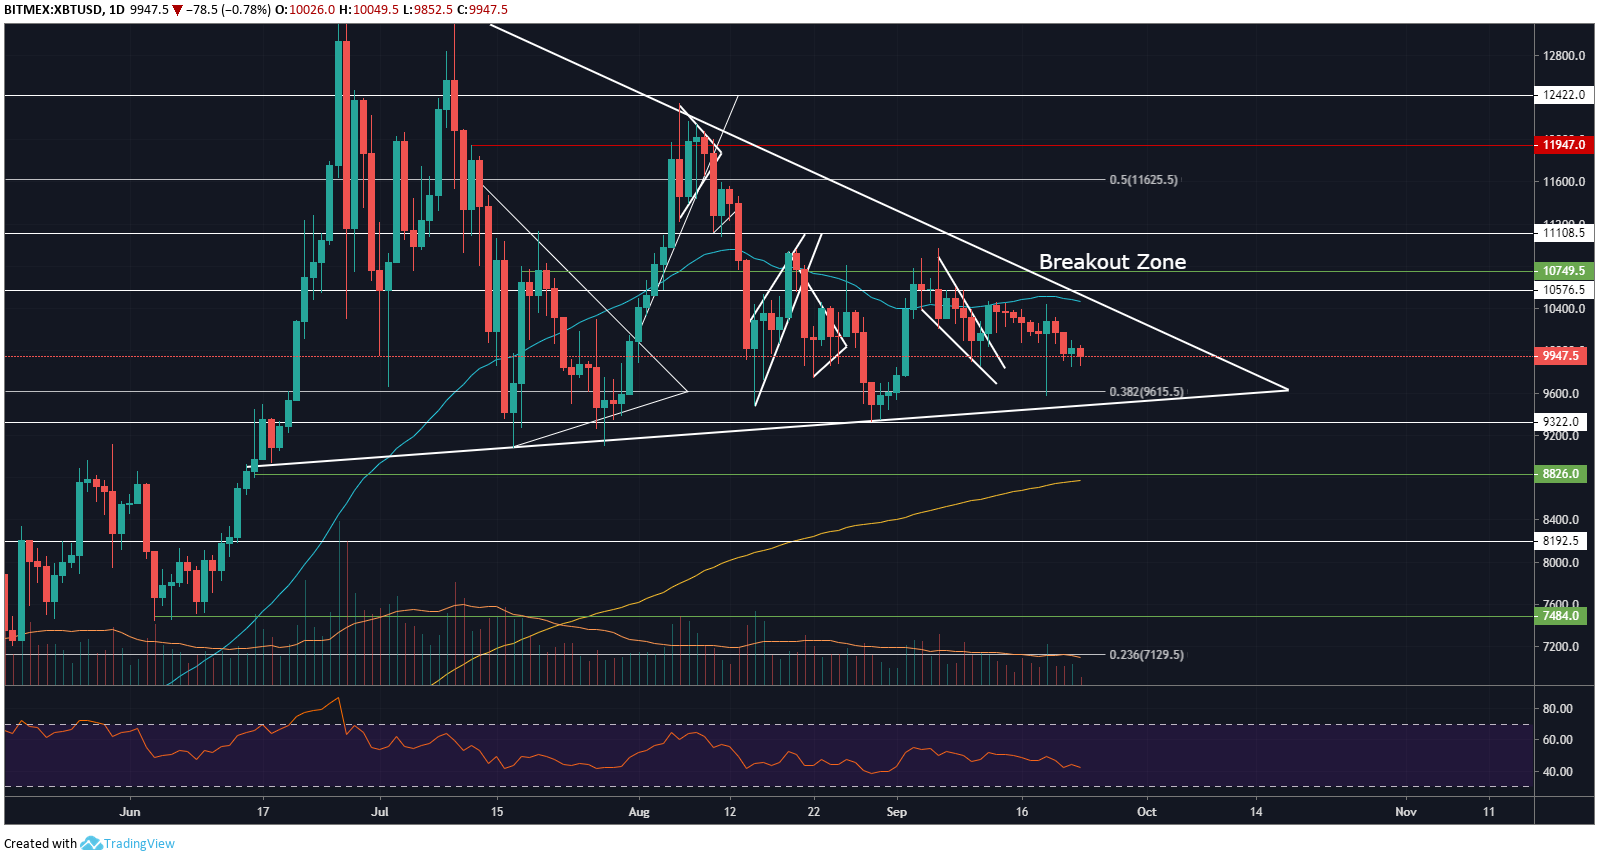
On the 1 Day chart for XBT/USD, we can see the 50 MA trading just above the current market price. This will now act as a resistance point running just below the breakout zone. We know if both the 50 MA and overhead resistance of the visible asymmetrical triangle are broken to the upside then Bitcoin is very much bullish and will likely re-test $11,100 or higher.
Similarly, the 200 EMA runs just below the break-down point of the asymmetrical triangle at $8,800 which will act as a key support level if price action decides to break down. Volume levels have been decreasing since the high just short of $14,000, which is clearly visible from the volume moving average. This is a very strong indication that price levels will break below the asymmetrical triangle unless a clear influx of volume enters.
Key support levels to consider taking profit on shorts, or adding to longs if price action breaks below $9,400 are $8,800, $8,190, $7,480 and $7,200.There could be a swift drop to around the $7,200 mark that could quickly get eaten up by buyers and propel price levels back up to the $10,000 mark within quick succession. This will result in a common practice of shaking out weak hands taking place as the sentiment could sway bearish.
Do you think Bitcoin will break down to $7,200 over the coming weeks? Please leave your thoughts in the comments below!
This article is strictly for educational purposes and should not be construed as financial advice.
Images via Shutterstock, XBT/USD charts by Tradingview
The post Bitcoin Price Analysis: BTC Poised For Drop To $7,200 as Altcoins Tumble appeared first on Bitcoinist.com.

Bitcoinist.com is author of this content, TheBitcoinNews.com is is not responsible for the content of external sites.
Our Social Networks: Facebook Instagram Pinterest Reddit Telegram Twitter Youtube


