


Bitcoin bounced right off of the key triangle support on all time-frames at $9,350 on the 30th of August causing bullish divergence to play out. Since then price levels have pumped to $10,700 as price levels near a key breakout point.
Bitcoin 1-Hour Analysis
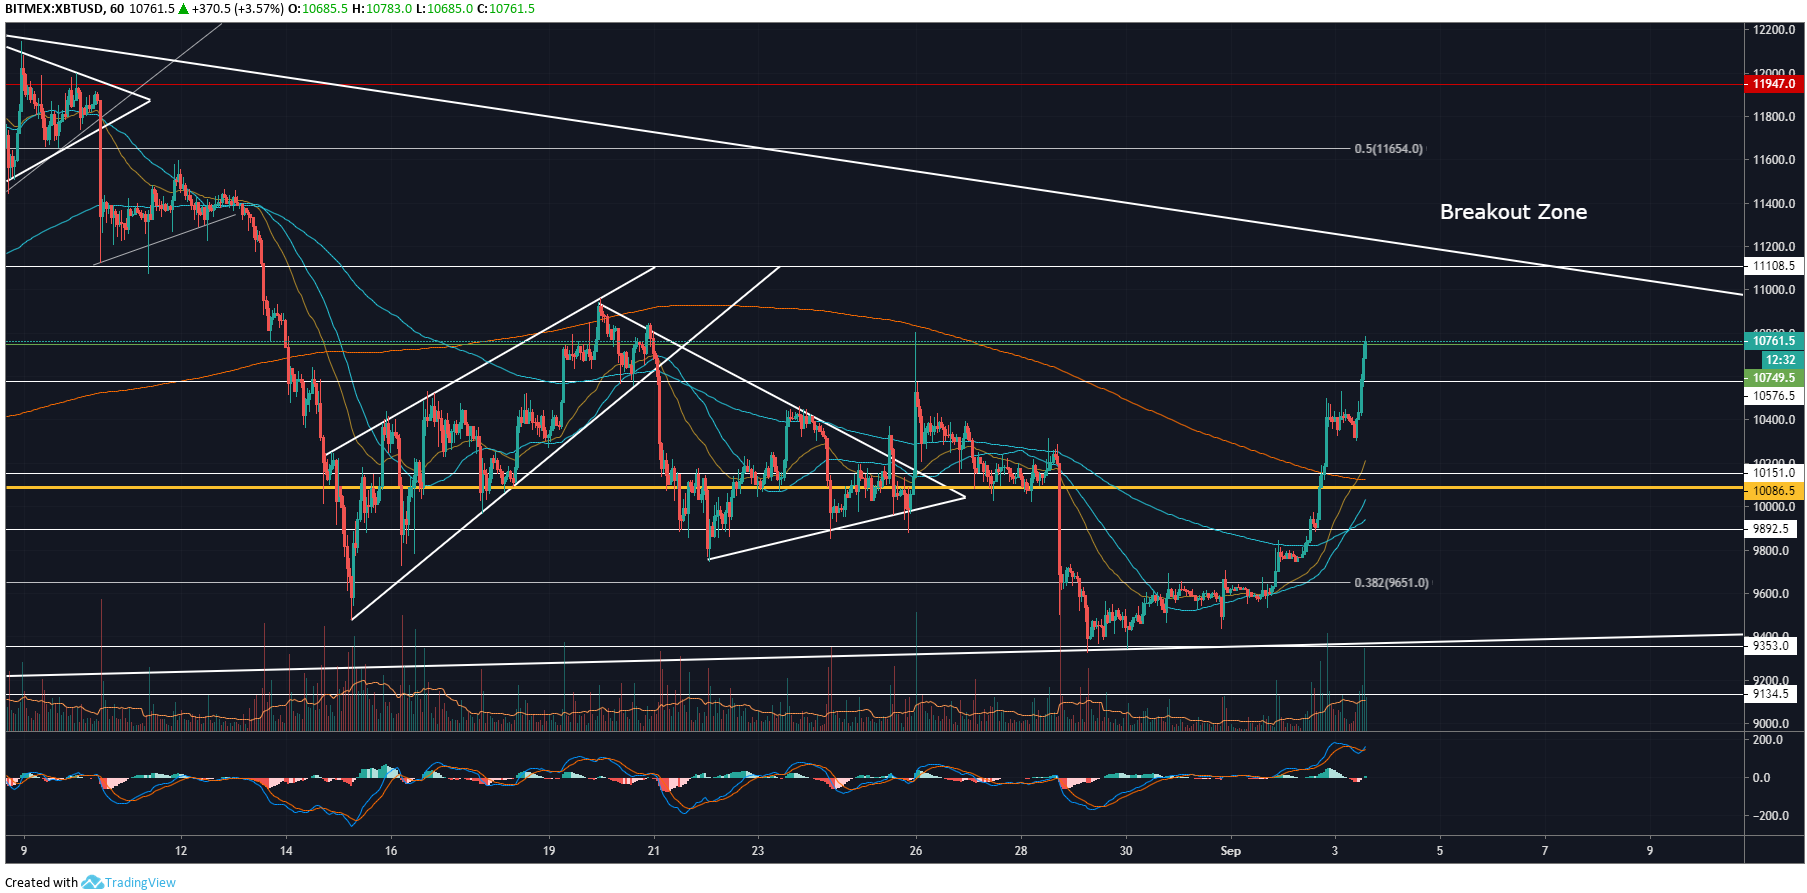
On the 1 hour chart for XBT/USD, we can see where the price action has undergone a short-term reversal. The reversal was initiated off a key support level at $9,350, as mentioned in my previous Bitcoin analysis, which was also just below the ever-important 0.382 Fibonacci level. $10,750 was broken on the most recent leg up indicating strength and momentum forming for the bulls.
Volume has begun to drastically increase over this time frame which is a key factor to look out for to sustain any form of up-trend – especially after prior volume levels were so low. POC (Point of Control) at $10,000 was a key resistance level and now that it has been broken, it is likely that Bitcoin will attempt a breakout of $11,000 over the coming days.
MACD has crossed up convincingly on this move to the up-side and has touched the 200.00 level indicating momentum is very much with the bulls. 200.0 is the highest point levels have reached on the visible range for the 1-hour chart displayed. 20 SMMA has crossed over the 500 MA, so now we are waiting for the 200 EMA to also cross above the 500 MA for further confirmation. This will likely happen in conjunction with a breakout at $11,000.
8-Hour Analysis
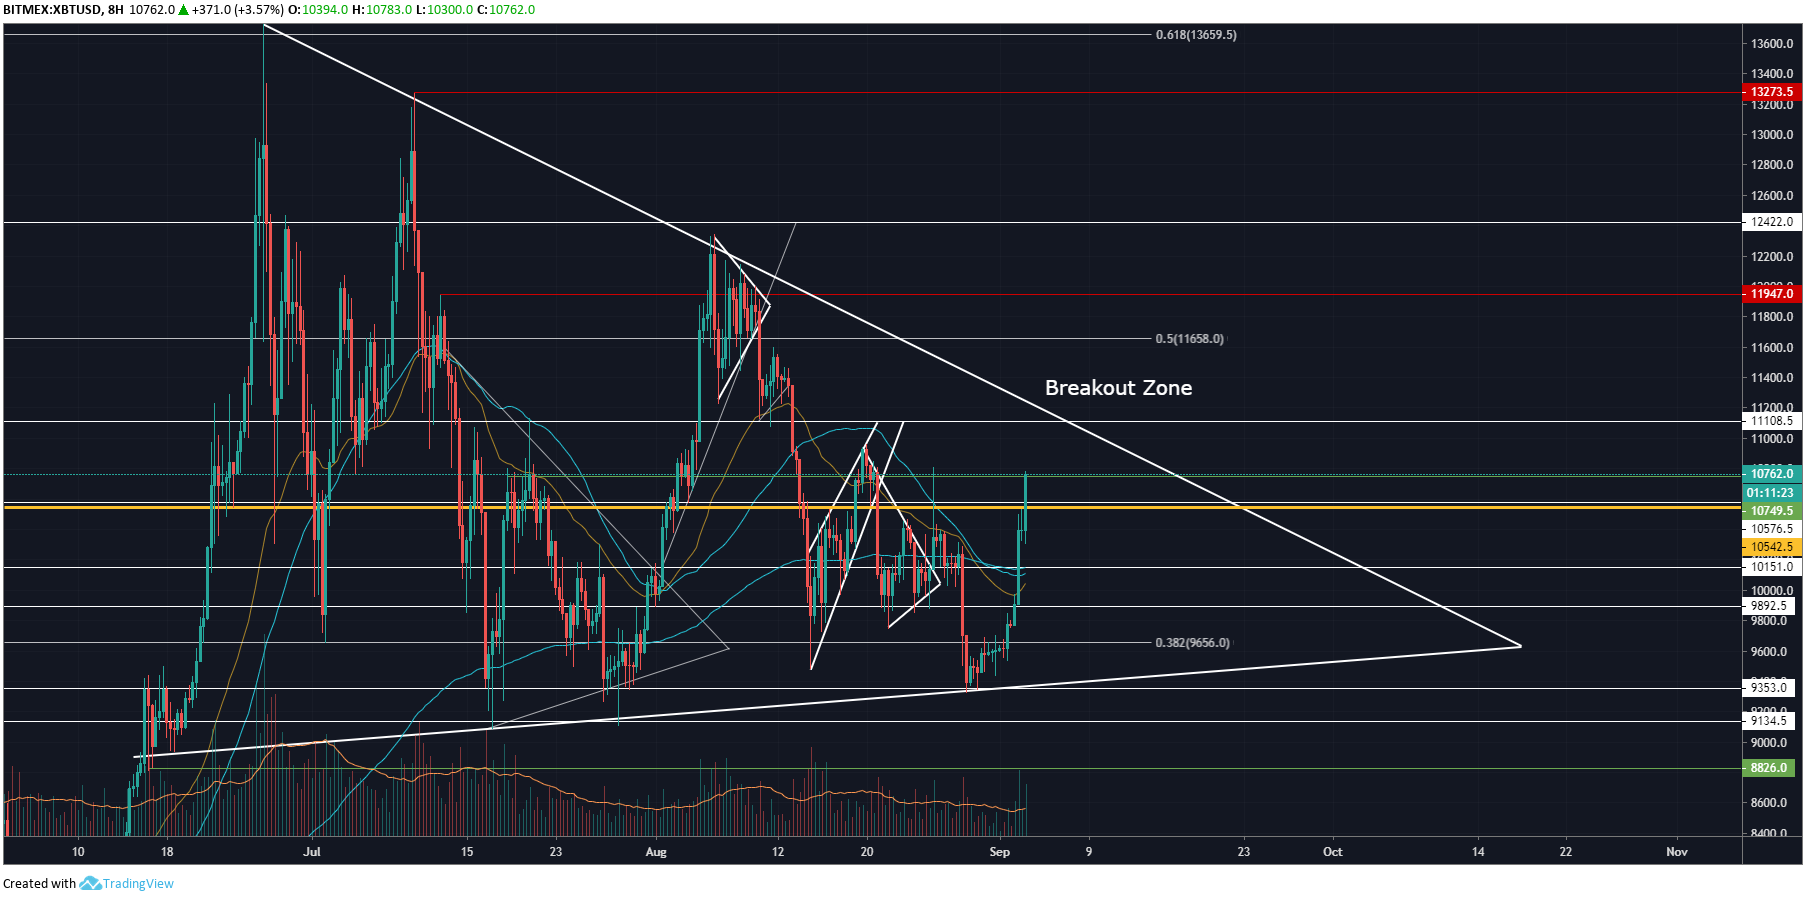
On the 8 hour chart for XBT/USD, we can see both the 200 EMA, 20 SMMA, and 50 MA have all bunched up together as they begin to curl up in conjunction with price levels pumping. The 8 hour POC at $10,750 has also been surpassed.
Bitcoin trading volume has begun to uptick but still seems low in comparison to volume seen throughout July. For this reason, it is possible that price levels won’t actually break $11,000 in the coming days, and will need further consolidation within the asymmetrical triangle throughout September and potentially into October.
Once price action has broken out into the breakout zone on the technical analysis provided, key resistance levels to look out for are $11,100 (price levels must surpass this to confirm the breakout) followed by the 0.5 Fibonacci level at $11,650, resistance at $11,950 and $12,420. Its likely Bitcoin will surpass all of these levels if a clear breakout takes place as the sentiment is still very much bullish. A pull-back within the triangle to $9,600 before then is likely.
Do you think Bitcoin will surpass $11,100 before September ends? Please leave your thoughts in the comments below!
This article is strictly for educational purposes and should not be construed as financial advice.
Images via Shutterstock, BTC/USD charts by TradingView
The post Bitcoin Price Analysis: Bullish Divergence Causes Price Levels To Pump appeared first on Bitcoinist.com.

Bitcoinist.com is author of this content, TheBitcoinNews.com is is not responsible for the content of external sites.
Our Social Networks: Facebook Instagram Pinterest Reddit Telegram Twitter Youtube


