


Over the weekend, a strong rally was stifled by an even stronger rejection as the bitcoin market was shoved into a band of overhanging resistance. This band of resistance has been mentioned several times in our analyses over the last few weeks as it has proven impossible to overcome for the time being:
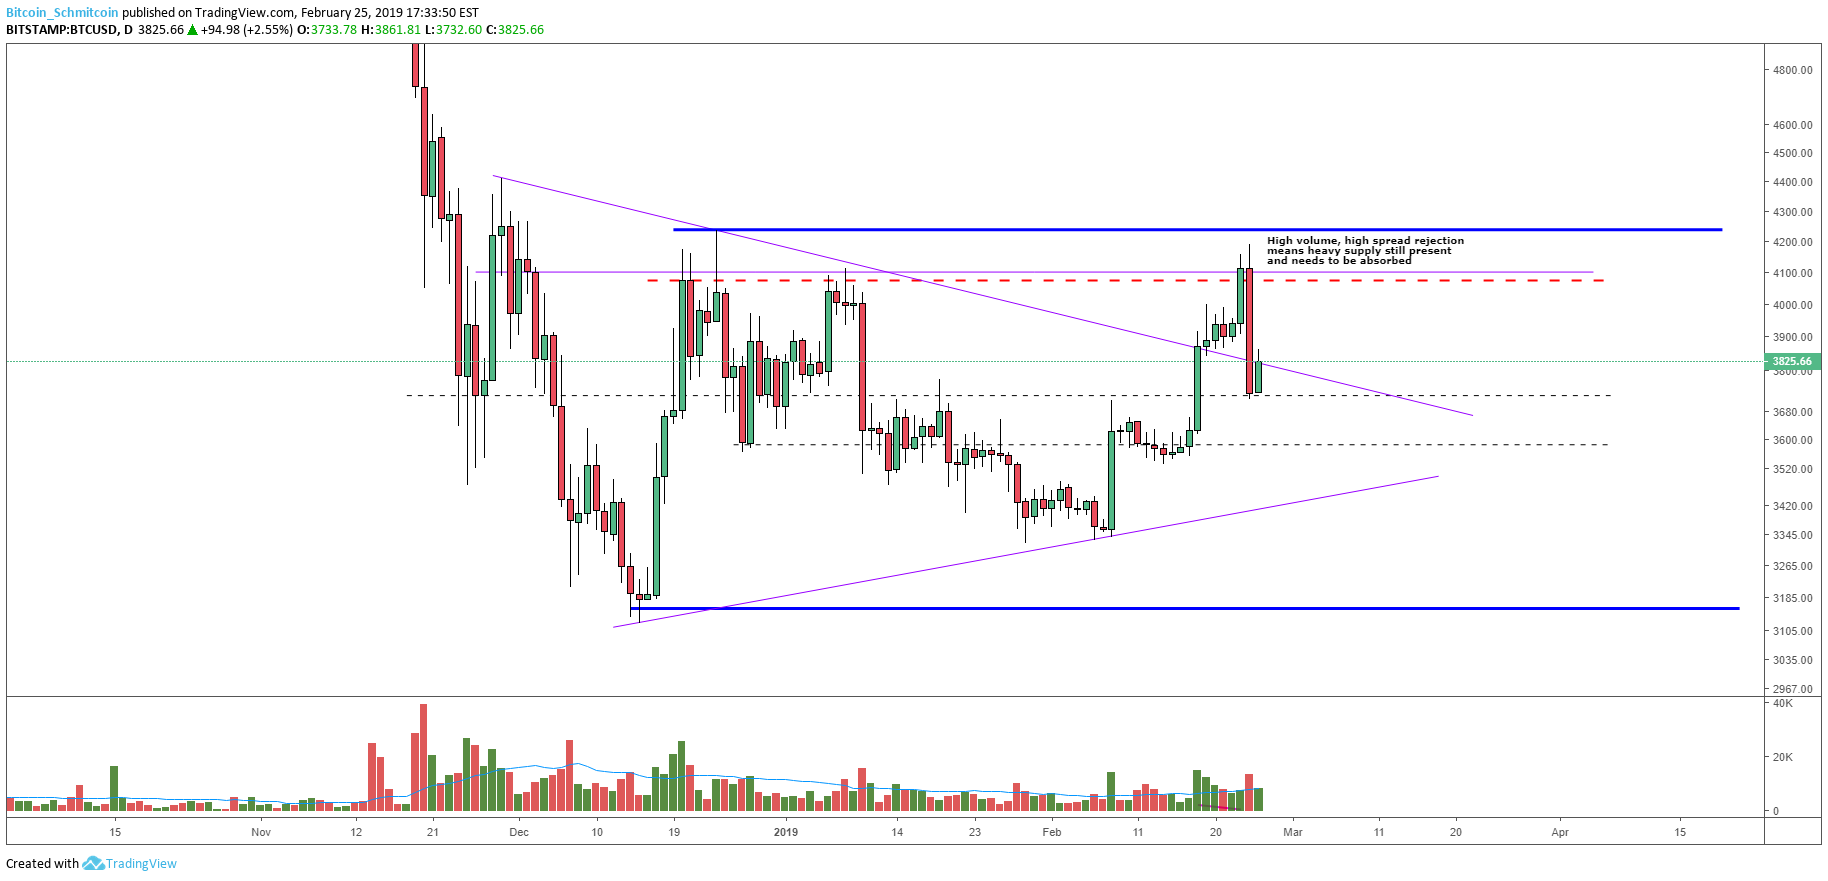
Figure 1: BTC-USD, Daily Candles, Failed Breakout
This run to the low $4,000s coincided with a breakout of a rather large symmetrical triangle consolidation shown above. It managed to establish a new, local high but was immediately rejected on high volume and very high spread. This rejection formed a candle called a “bearish engulfing candle” that completely wiped out a week and a half’s worth of gains in just a couple hours.
This rejection should not be underestimated as it represents a failed consolidation. Patterns that break out and see 100% retracements to the breakout point often are signs of a potentially strong market reversal. In our case, it would be a reversal of our local uptrend.
This rally represents a third failure to break our bearish market structure and likely means we will be visiting the low $3,000s to test support/demand once again. Sitting just below our current market low is a strong, macro support level that could see a test if the demand is weak:
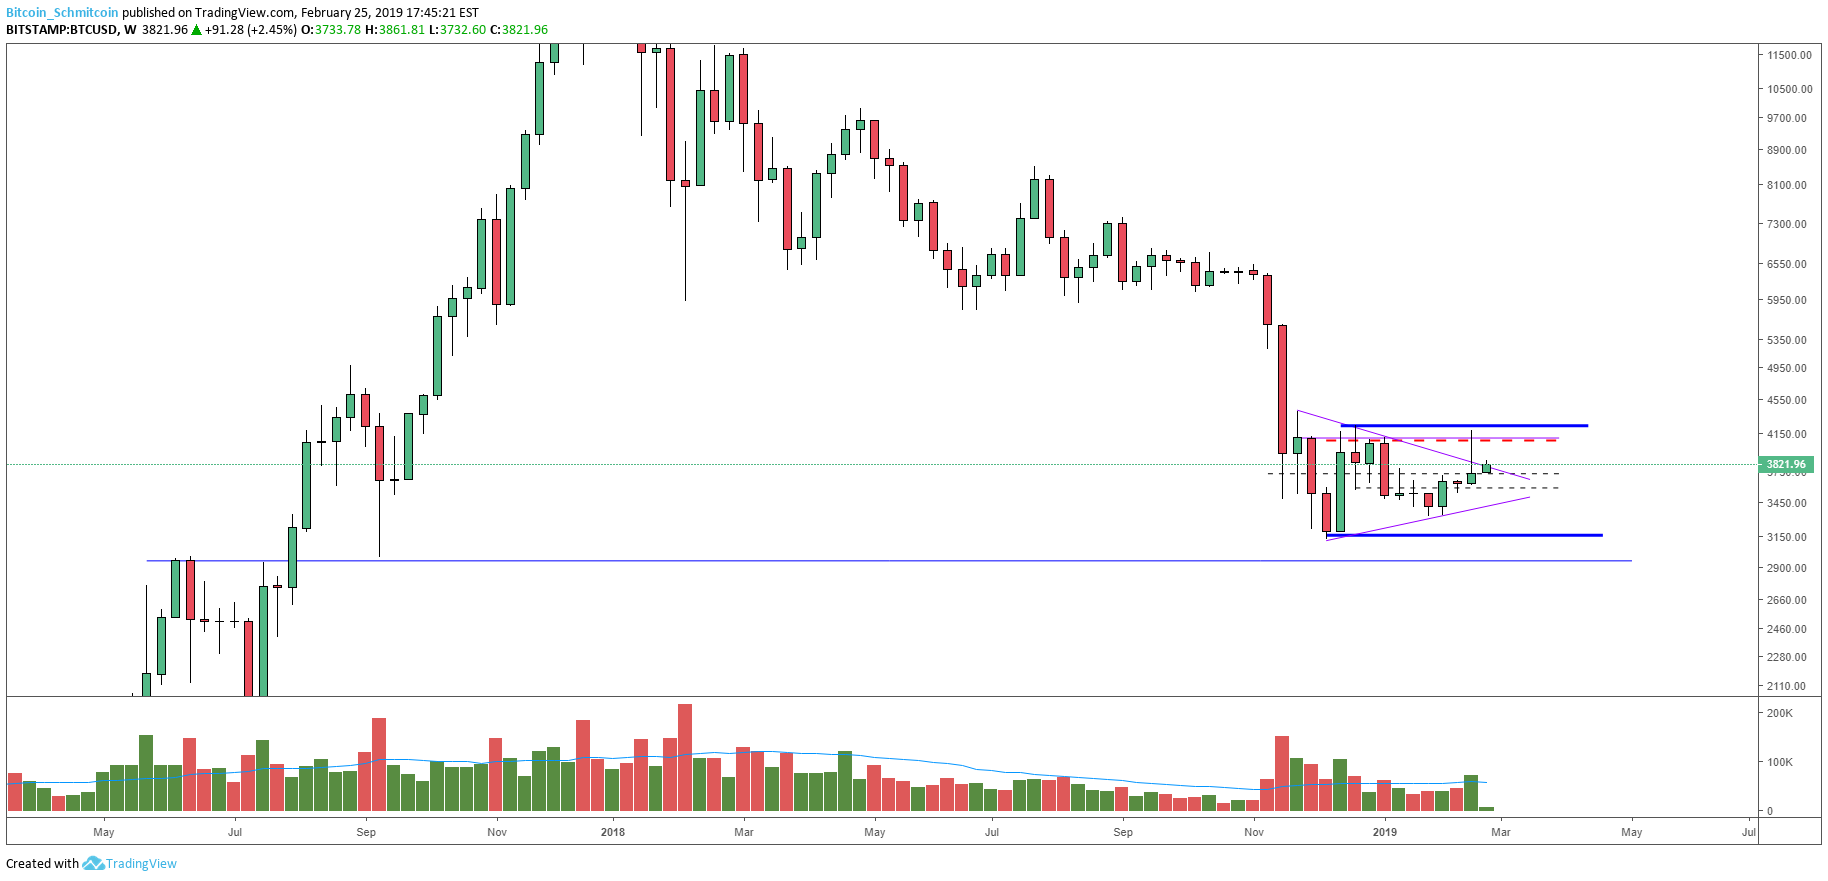
Figure 2: BTC-USD, Weekly Candles, Macro Support Level
A test of the zone between $2,900 and $3,100 almost seems inevitable, given the amount of failed rallies and constant supply surfacing in the low $4,000s. However, if we manage to continue the uptrend, the milestone we must keep an eye out for is a daily close above the $4,250 level shown in Figure 1. A close above that level will represent the first higher high since we bottomed at $3,100.
For now, the market structure remains bearish as we continue the trend of lower highs. The rallies are becoming weaker and the supply is drowning the remaining demand toward the top of our trading range:

Figure 3: BTC-USD, Daily Candles, High Volume Rejections
When looking at the health of these rallies, it becomes apparent that the efforts vs. results of the rallies are lopsided. We see a high amount of effort by the bulls to move the price and a relatively low amount of effort from the bears to wipe out days’ worth of progress.
If we manage to retest the bottom of the trading range, we will gather more evidence as the market tests the strength of the demand. For now, it appears the bulls are running out of steam. As mentioned earlier, if we manage to continue the uptrend, keep an eye out for the $4,250 level, as a close above it will show a break in the currently bearish market structure.
Summary:
- Over the weekend, a strong round of selling wiped out a week and a half’s worth of buying pressure.
- The selling coincided with a failed symmetrical triangle breakout — this often leads to power market reversals.
- Bullish pressure seems to be waning as every attempted rally is quickly dispatched by strong bearish pressure.
Trading and investing in digital assets like bitcoin is highly speculative and comes with many risks. This analysis is for informational purposes and should not be considered investment advice. Statements and financial information on Bitcoin Magazine and BTC Inc related sites do not necessarily reflect the opinion of BTC Inc and should not be construed as an endorsement or recommendation to buy, sell or hold. Past performance is not necessarily indicative of future results.
For the latest Bitcoin News, join our Telegram!

Bitcoinmagazine.com is author of this content, TheBitcoinNews.com is is not responsible for the content of external sites.
Our Social Networks: Facebook Instagram Pinterest Reddit Telegram Twitter Youtube


