


Bitcoin buyers are fighting to remain inside a sideways channel as bears attempt to take back control of the asset. Have we seen the top of the bull market already or will bulls deliver another knockout performance soon? Let’s take a look at the bitcoin price analysis.
Bitcoin Price Analysis: 30-Minute Chart
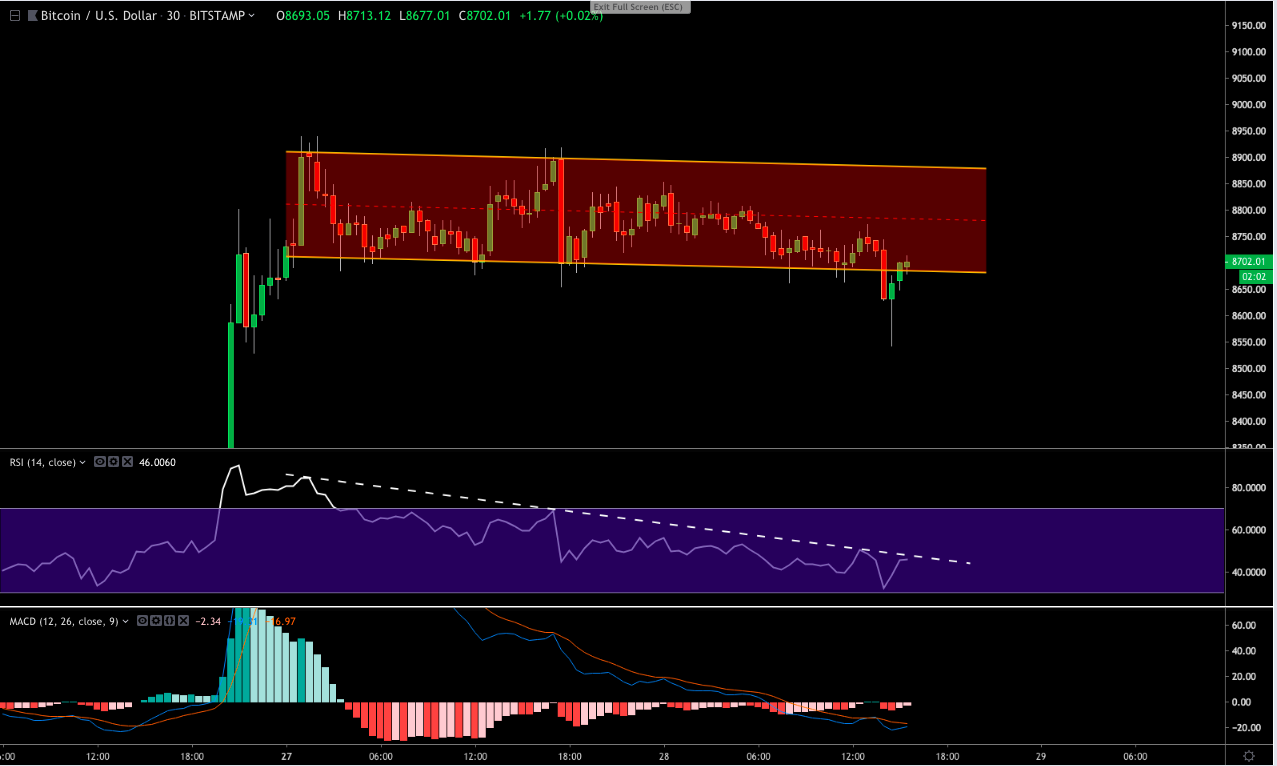
On the 30-minute BTC/USD chart we can see that the asset has just recovered back inside a sideways channel that it had been tracking inside of for the last 2 days.
A sudden 2.2% crash during the Western trading session today (14:00 – 14:30 UTC+1) pushed the asset through the channel support at $8,680 temporarily and down on to the $8,540 level below.
Bullish traders were quick to react, however, and have already managed to reclaim the $8,700 support. If they can defend this level then it will be a promising sign that BTC buyers still have life in them and that the recent rally to Bitcoin’s new YTD-high at $8,940 yesterday has not completely exhausted them.
If the price fails to hold above $8,540 however, then we could expect to see the asset plummet further as traders exit out of BTC into stablecoins or other cryptocurrencies to secure their fiat gains.
Looking at the RSI, we can see that the indicator line has been running into strong resistance over the last few days. A clear downtrending level (white dashed line) has prevented bullish momentum from printing new highs on four occasions and is continuing to drive it down towards the oversold region below. This is a particularly worrying sign that suggests buying momentum is diminishing.
A similar trend can also be seen on the MACD indicator with both the 12 and 26 moving averages diving beneath the signal line, and increasing selling volume appearing on the histogram.
From these two indicators, it appears that Bitcoin could break bearish unless bullish traders regain composure soon.
Bitcoin Price Daily Chart
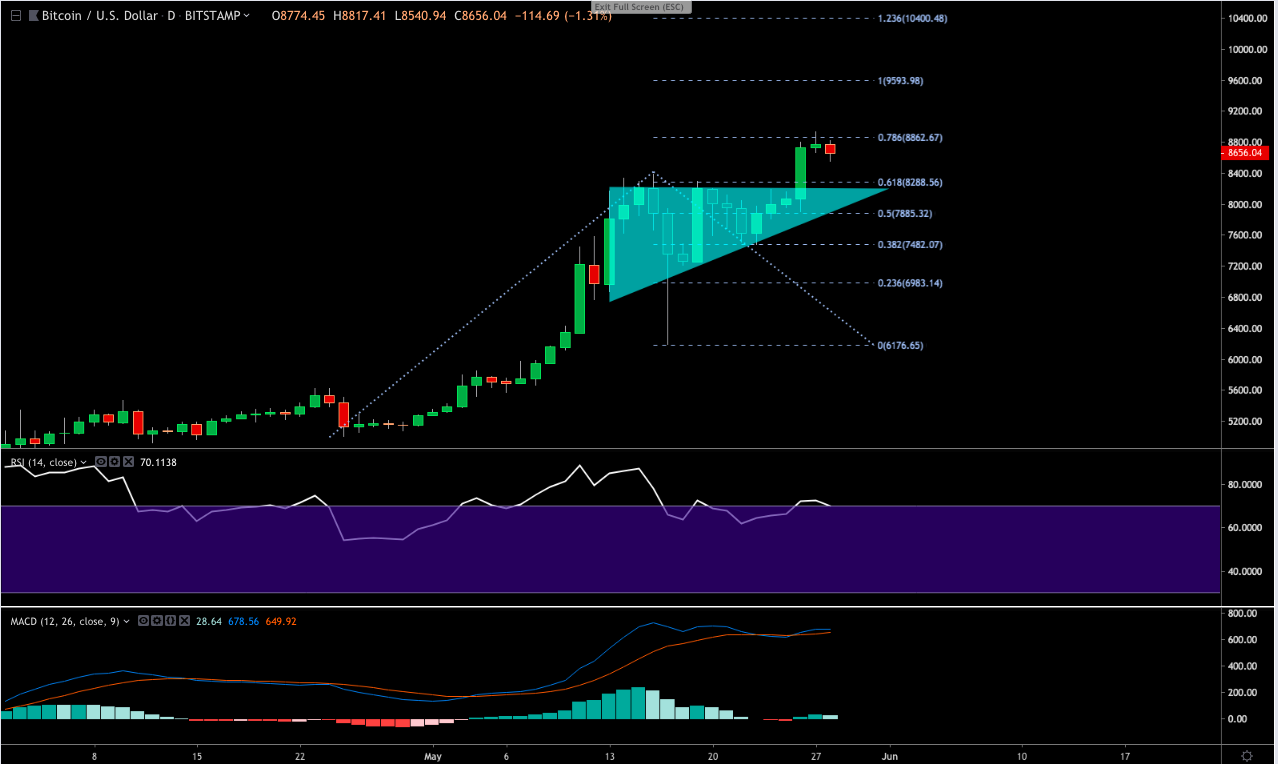
On the 1D BTC/USD chart, we can see that the price action has run into strong resistance at the 0.786 Fibonacci extension level ($8,862.67), after breaking bullishly out of the ascending triangle pattern that we analyzed last week.
Looking at the RSI, we can see that the indicator line failed to make a higher high above the overbought region than the previous high did, despite BTC hitting a new YTD-high. This suggests that Bitcoin’s uptrend is not as strong as it appears, and could be hinting at a possible reversal.
If the Bitcoin bull market did begin to correct, we could expect the 0.618 and 0.5 extension levels to provide some key support ($8,288.56 and $7,885.32 respectively).
What to Look Out For
All eyes are on the $8,700 support right now, and whether bullish traders can remain inside the intraday channel or not. If Bitcoin’s price closes the day above this level, then bullish traders will be in a good position to retest the new $8,940 resistance. If bears manage to crush the support, then we could begin to see confidence depart from the market.
A return above the 20 SMA line on the 30-Minute chart will be a good sign to watch out for as an early indicator of improving short-term bullish momentum.
Other promising signals to look out for will be if the 30-minute RSI breaks free of its downtrending resistance, and the 12-MA bullishly converges above the 26-MA on the MACD.
Trade Bitcoin (BTC), Litecoin (LTC) and other cryptocurrencies on online Bitcoin forex broker platform evolve.markets.
The views and opinions of the writer should not be misconstrued as financial advice. For disclosure, the writer holds Bitcoin at the time of writing.
Images courtesy of Shutterstock, Tradingview.com
The post Bitcoin Price Analysis: Bulls Battle to Remain Inside Sideways Channel appeared first on Bitcoinist.com.

Bitcoinist.com is author of this content, TheBitcoinNews.com is is not responsible for the content of external sites.
Our Social Networks: Facebook Instagram Pinterest Reddit Telegram Twitter Youtube


