

In just a few short days, the BTC-USD price dropped nearly $700 in value in a move that consequently managed to drop the entire crypto-market by almost 25 percent:
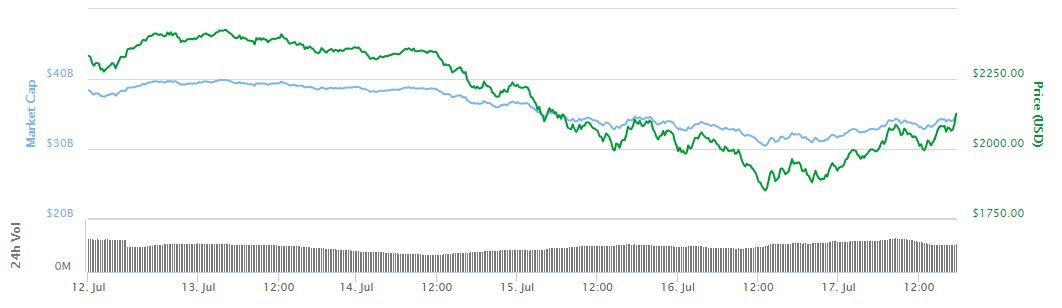 Figure 1: BTC-USD Market Cap
Leading up to this weekend’s drop in BTC-USD price, several previous BTC-USD market breakdowns (click here and here for details) tracked the progress of a massive Head and Shoulders Pattern. The estimated price target of the Head and Shoulders pattern left the previous market value of $2,400 poised to drop steeply to $1,800. If you are reading this article, you are probably wondering what the heck just happened and if the carnage is going to continue …
First, let’s take a look at how the market reacted to the completion of this Head and Shoulders pattern and then extrapolate what that may mean for the overall trend of BTC-USD. The figure below shows the key support levels that were broken during the fall this weekend:
 Figure 2: BTC-USD, 6-hr Candles, GDAX, Head and Shoulders Key Support Levels
After the initial breakout of the Head and Shoulders, the price took a steep plunge downward. Ultimately, after several days of a strong bear market (and several significant support levels broken), we reached our price target of $1,800 before bouncing and beginning the process of retesting crucial support (now turned resistance) levels:
 Figure 3: BTC-USD, 6-hr Candles, GDAX, Broken Support Levels
With very little effort, the BTC-USD market managed to reach its price target and appears to be making a recovery — but is this a fake-out? Are we bouncing back to our previous trend? Not likely. Below are some of the more glaring reasons why I think this bear still has some bite left in it.
On the higher timescales, BTC-USD is actually showing strength in downward momentum of this move. No MACD divergence (loss in market momentum) is visible. The lack of macro-trend divergence indicates that the market still has plenty of downward pull left in it before it strongly begins to resist the lower prices.
 Figure 4: BTC-USD, 12-hr Candles, GDAX, No Divergence
On a smaller, one-hour scale, the market is strongly diverging in a bearish fashion. Although the market had a decent rebound off the bottom of the recent run, it is quickly losing steam (indicated by the divergence shown on the 1-hr MACD and labeled in pink). Not only is it diverging on the 1-hr MACD, across the length of the bear run, the market doesn’t seem comfortable maintaining the downward momentum across multiple bearish/bullish periods (shown in yellow):
 Figure 5: BTC-USD, 1-hr Candles, GDAX, 1HR Bearish Divergence
It’s nearly impossible to predict the true bottom of a sustained bear or bull market, so it is very important to keep an eye on the market and constantly update your perspective. At the moment, there are several indicators that BTC-USD has a sustained bear market in its future. And, as we’ve seen over the course of several weeks: what brings Bitcoin down brings everyone down.
Summary:
-
The Head and Shoulders pattern predicted in previous articles completed its price target of $1,800.
-
There are multiple signs that the BTC-USD bear market still has downward momentum left in it.
Trading and investing in digital assets like bitcoin and ether is highly speculative and comes with many risks. This analysis is for informational purposes and should not be considered investment advice. Statements and financial information on Bitcoin Magazine and BTC Media related sites do not necessarily reflect the opinion of BTC Media and should not be construed as an endorsement or recommendation to buy, sell or hold. Past performance is not necessarily indicative of future results.

Bitcoinmagazine.com is author of this content, TheBitcoinNews.com is is not responsible for the content of external sites.
Our Social Networks: Facebook Instagram Pinterest Reddit Telegram Twitter Youtube


