


BTC bulls continue to push the bitcoin price higher, with the market-leading cryptocurrency up 2.56 percent on Saturday — as of this writing.
Bitcoin’s Hourly EMA Ribbon Providing Support
On the one-hour chart for Bitcoin, the exponential moving average (EMA) ribbon has, thus far, provided significant support for the price of BTC.
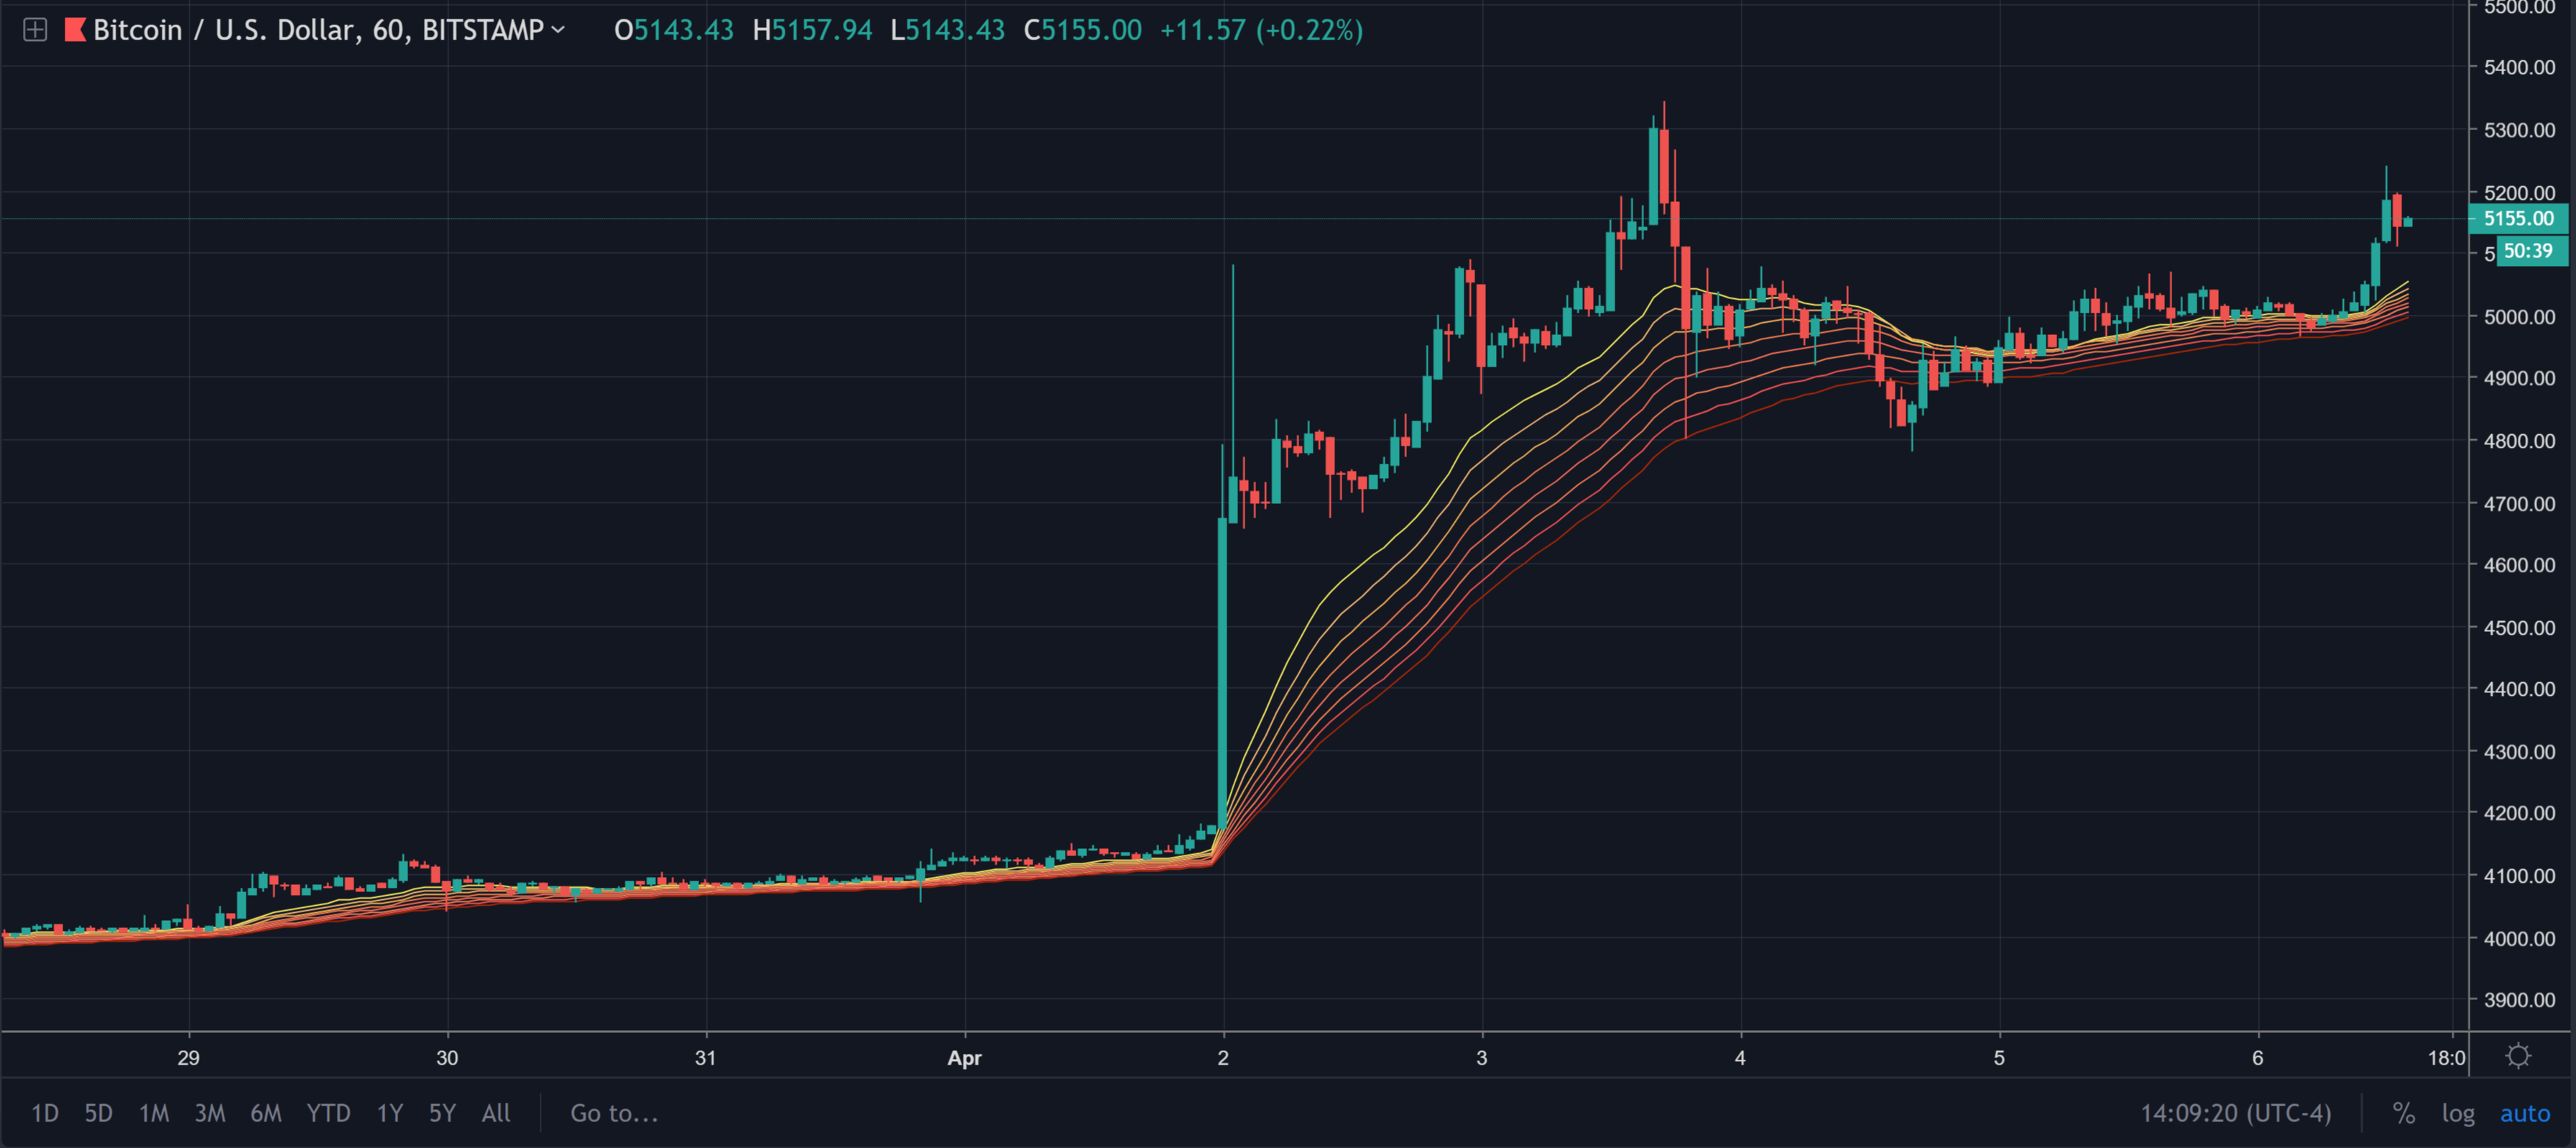
Bitcoin chart provided by TradingView.
The bitcoin price only dropped below the EMA ribbon once, on April 4 for a few hours, since commencing on its uber-bullish breakout rally. Since then, the ribbon has held strong as support for Bitcoin (BTC). This strong support has undoubtedly assisted in the price jumping up in recent hours.
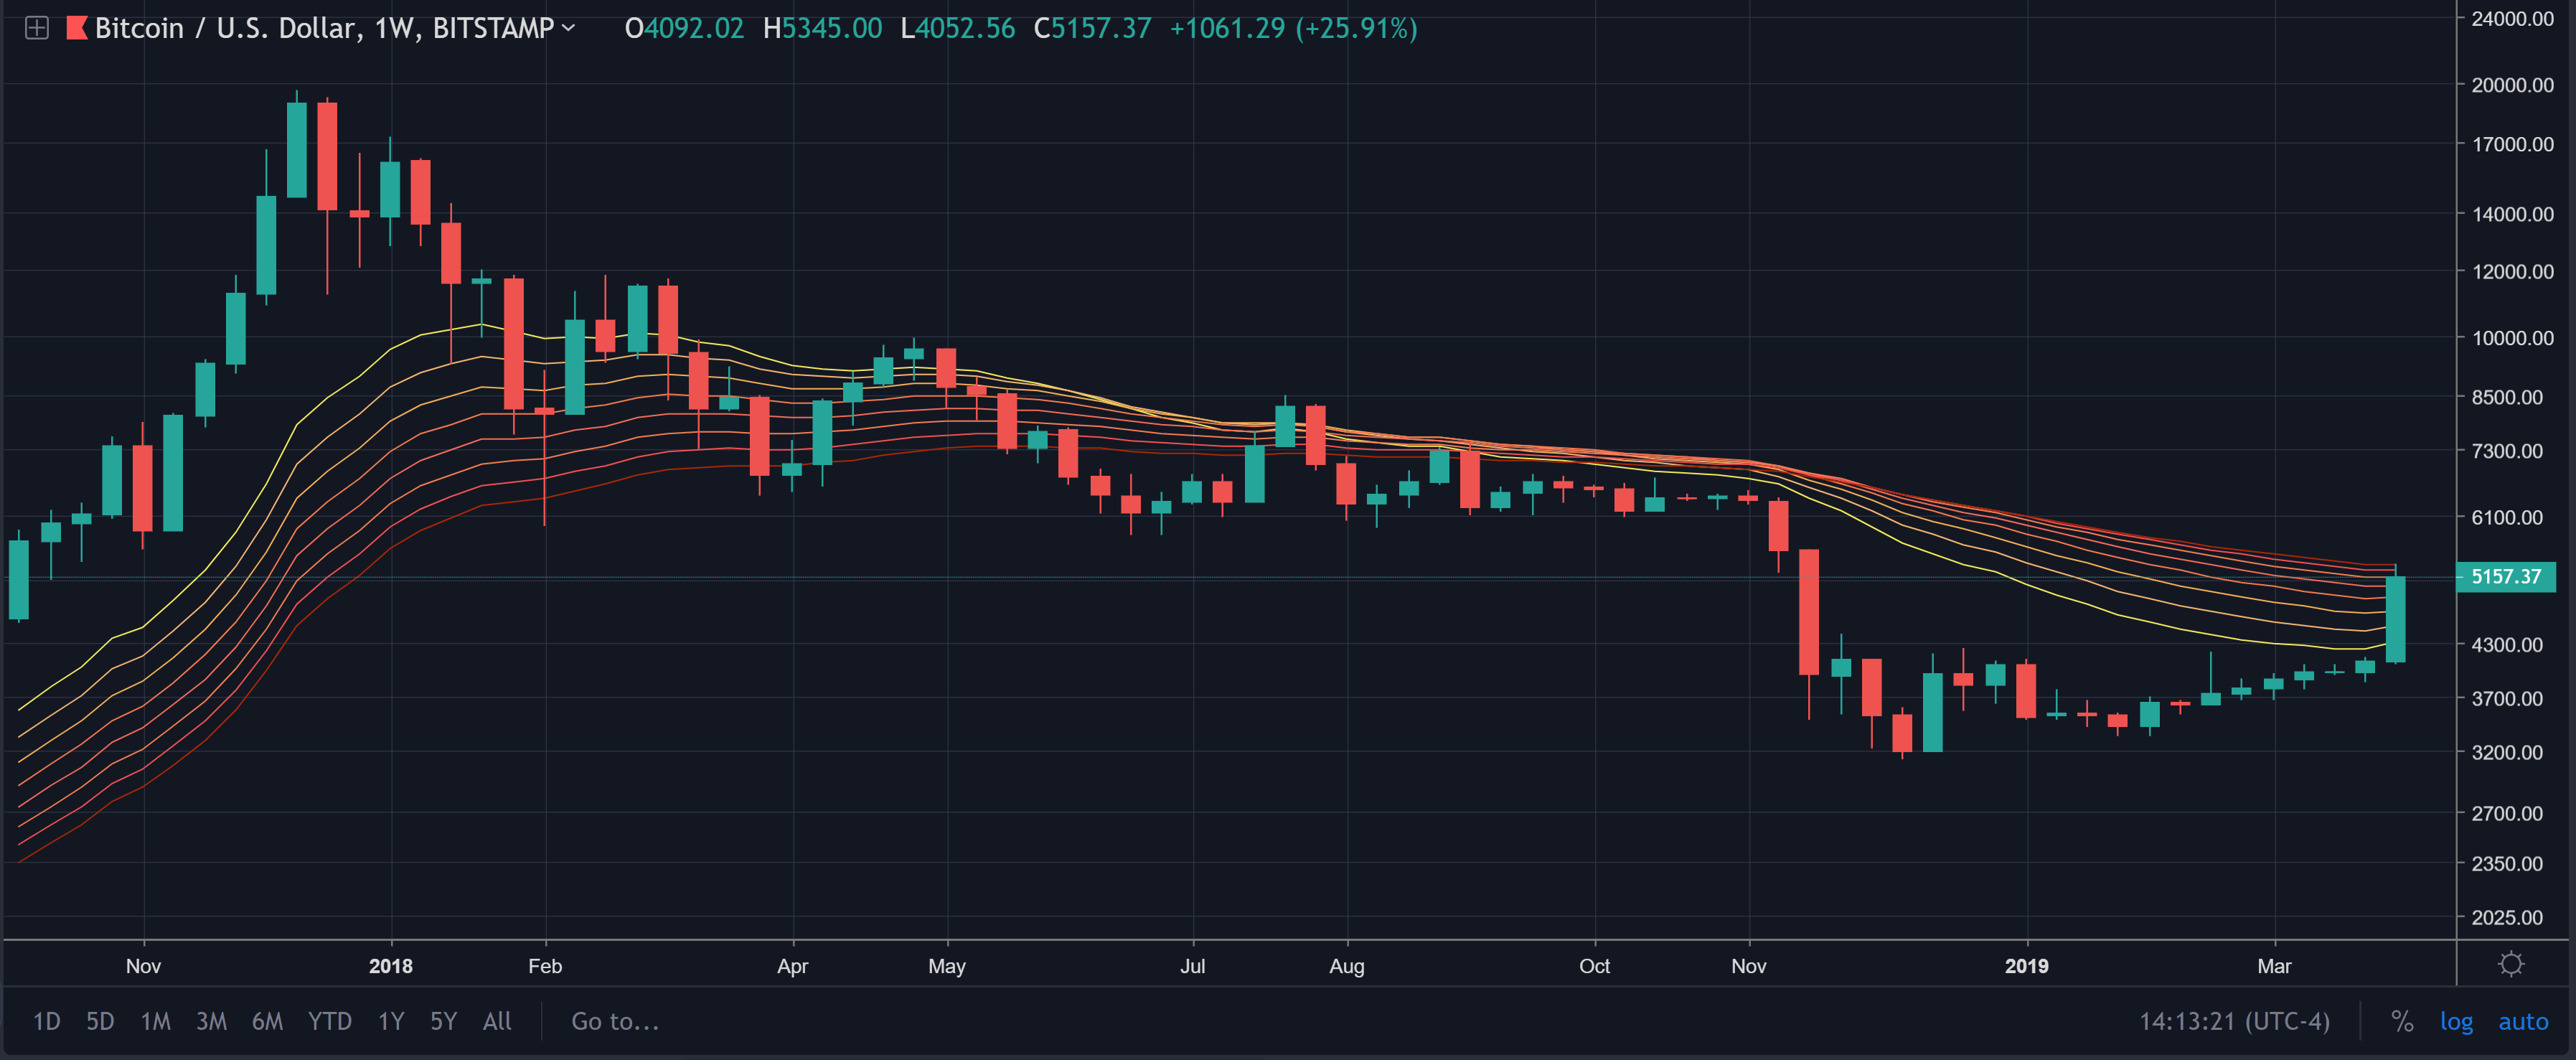
Bitcoin’s Weekly EMA Ribbon Under Siege
Bitcoin’s recent price surge has, thus far, topped out almost exactly at the upper band of the weekly EMA ribbon. However, price continues to knock on the door, with the bulls working hard to get a weekly close above $5400. Such a weekly close would be exceptionally bullish but nonetheless remains a tall order.
Weekly Stochastic RSI Refuses to Come Down
One potentially alarming factor for the sustainability of this impressive bitcoin rally is the fact that the weekly Stochastic Relative Strength Index (Stochastic RSI) refuses to come down from its extremely overbought levels. Instead, it is simply moving sideways while remaining maxed out.
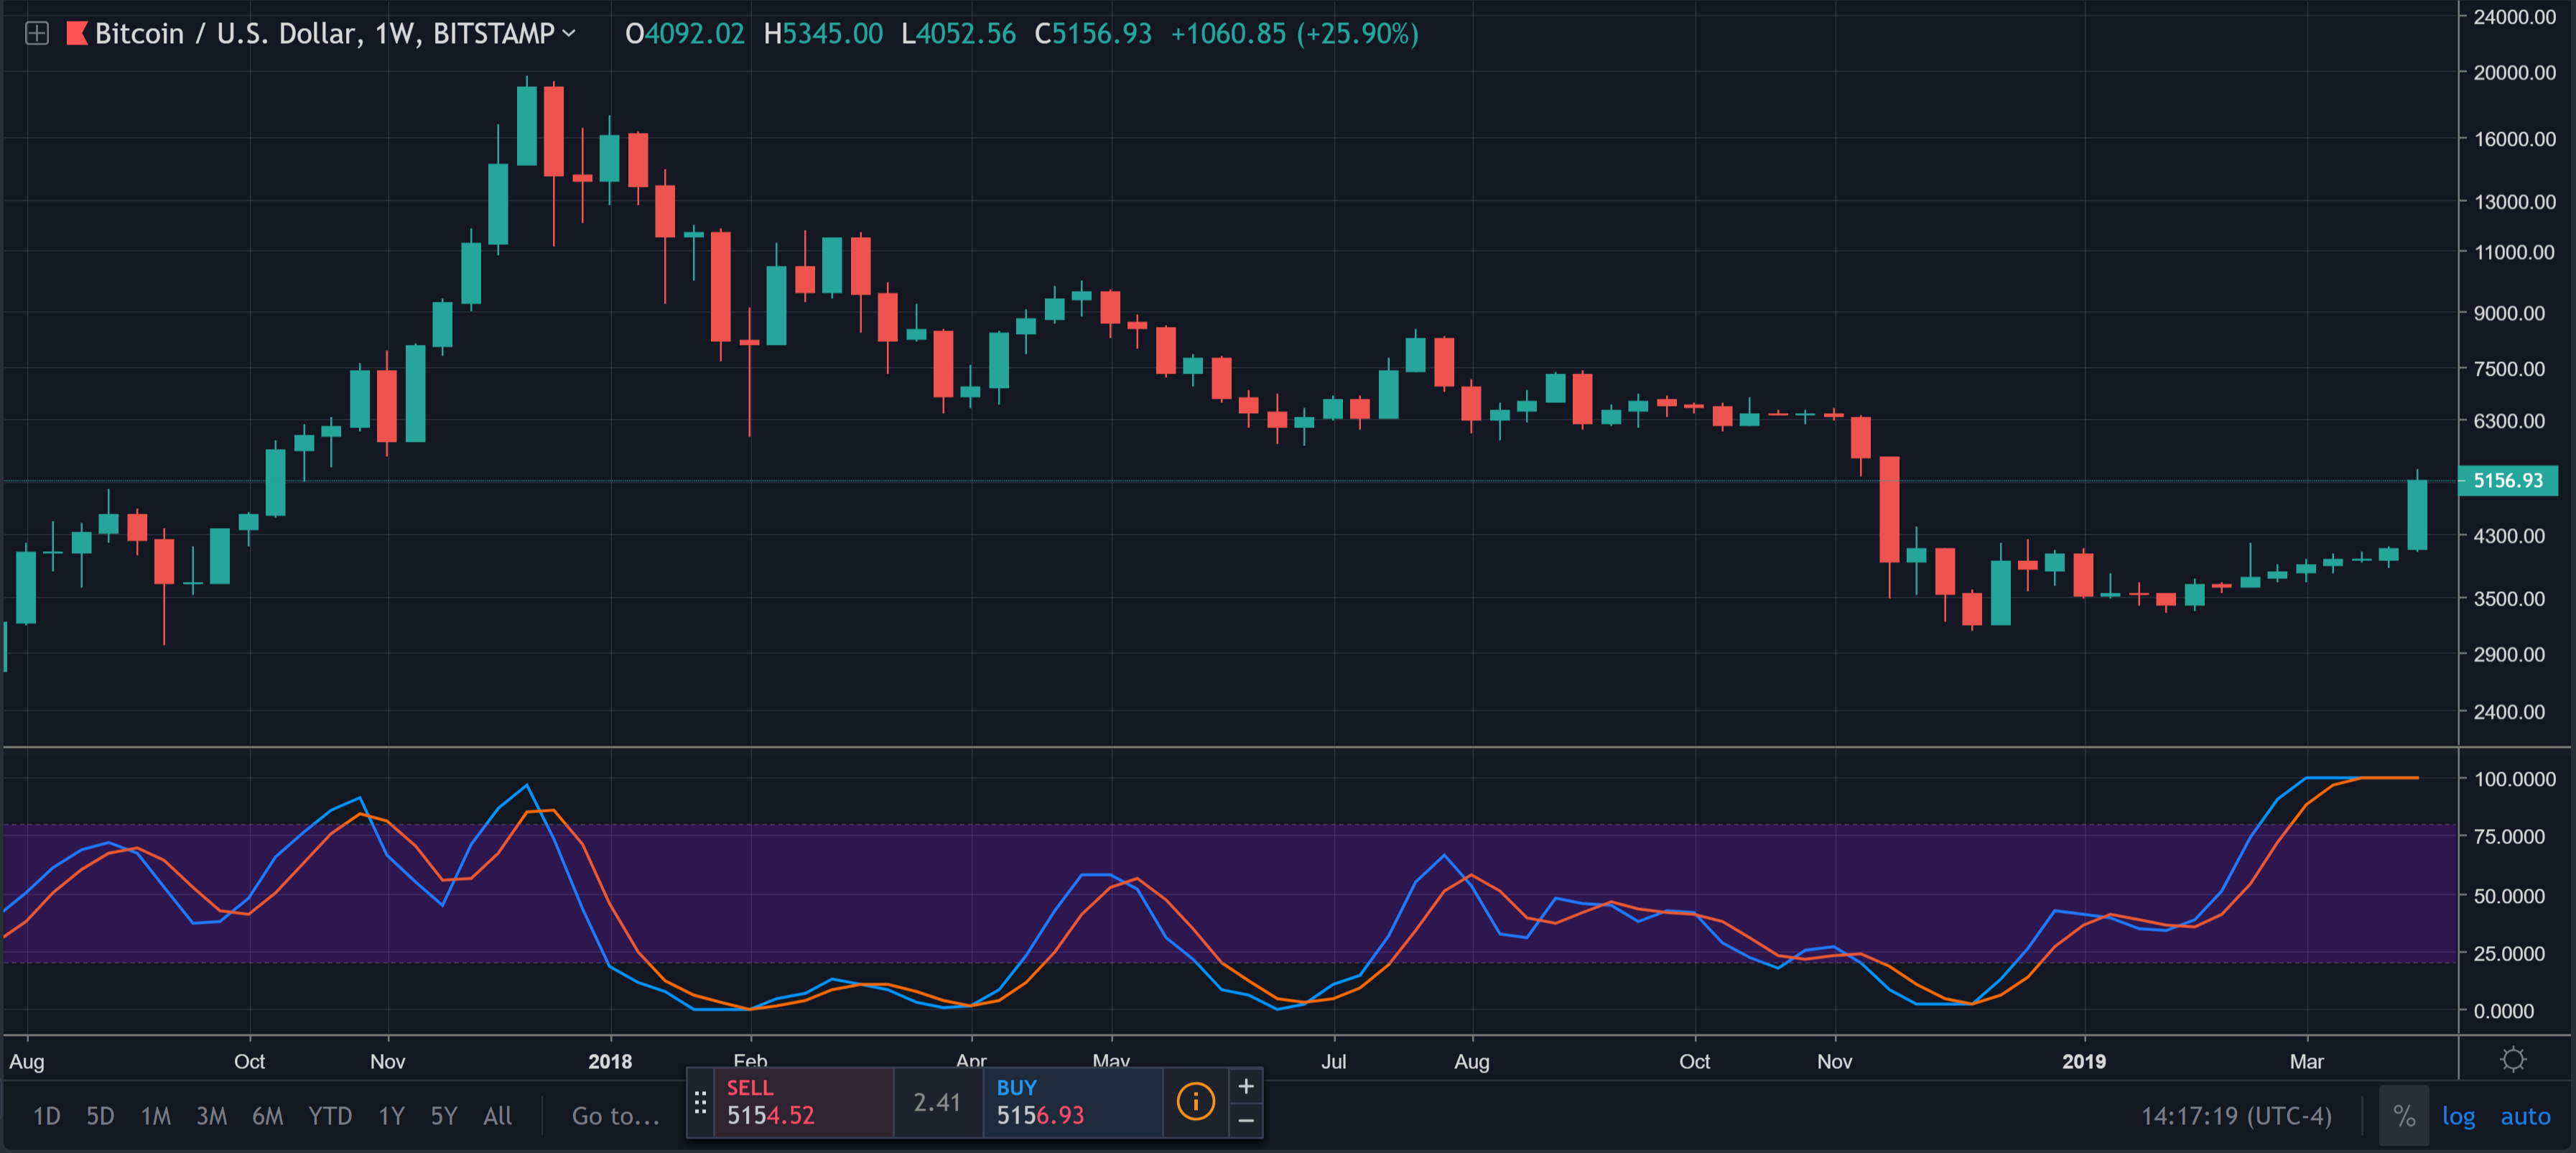
What goes up most certainly must come down, but the Stochastic RSI is far from the be-all-end-all of technical indicators. The bitcoin price could well keep surging towards what will undoubtedly prove to be a staunch resistance at $6,000 before the weekly Stochastic RSI comes back down to Earth.
Where Does Bitcoin Price Go From Here?
Nobody has a crystal ball, but it stands to reason that bitcoin could very well continue to rally as FOMO (fear of missing out) continues to build. However, there remains very little chance that the price of BTC will be able to sustain levels above $5,500 for very long without a corrective move.
The $6,000 mark will almost certainly provide extremely strong resistance. Should price reach this point, a profit-taking event or corrective move is probable. Such a move could potentially turn out to be a significant shakeout before truly confirming a bull run — but such speculation on the future movements of Bitcoin are purely educated guesswork at this stage.
Trade Bitcoin (BTC) and other cryptocurrencies on online Bitcoin forex broker platform evolve.markets.
Disclaimer: The views expressed in this article are not intended as investment advice.
What do you think about the current price of Bitcoin (BTC)? Let us know your thoughts in the comments below!
Images via TradingView, Shutterstock
The post Bitcoin Price Bulls Show Up on Saturday, Push BTC Back Above $5100 appeared first on Bitcoinist.com.

Bitcoinist.com is author of this content, TheBitcoinNews.com is is not responsible for the content of external sites.
Our Social Networks: Facebook Instagram Pinterest Reddit Telegram Twitter Youtube


