


- Bitcoin has undergone a strong rally since the $9,800 lows seen in September.
- As of this article’s writing, the leading cryptocurrency trades for $11,400.
- Some fear that this is just a bear market bounce that will result in a reversion to the lows.
- A crucial technical indicator suggests that this is not the case, that this is a true breakout.
- In fact, it shows that if Bitcoin moves above $11,500 in the near future, it will form a buy signal of macro importance.
- The last time this buy signal was seen was in April, prior to the 80% rally that took the coin from $7,000 to $12,500 in mere months.
Crucial Bitcoin Close Is About to Take Place
Bitcoin may soon be set to surge even higher if it manages to retake $11,500 decisively on a medium-term scale.
One crypto-asset trader recently shared the chart below, noting that Bitcoin is currently running up against a pivotal technical level. The chart shows that BTC is about to pass above a key pivot level, that held as support multiple times during the spring and summer rally.
Should Bitcoin soon move above $11,500, the indicator will form a “buy” signal last seen prior to the 80% rally from April to August.
Chart of BTC's price action since Feb with a level analysis by crypto trader Big Knife (@Bitcoinbigknife handle on Twitter).
Chart from TradingView.com
Fundamental Trends Agree
Fundamental trends agree with the positive sentiment indicated by the chart shared above.
Glassnode, a blockchain analytics firm, just reported that the number of active Bitcoin whales (meaning entities/wallets that hold over 1,000 coins) recently pushed above 1,800. Data shows that this is the highest that this metric has been at since some time in the middle of the 2017 rally:
“The number of #Bitcoin whales (entities holding ≥ 1K BTC) has been on an upwards trend for the past months. An indication that more high-net-worth individuals are entering the space to invest in Bitcoin in expectation of $BTC price appreciation.”
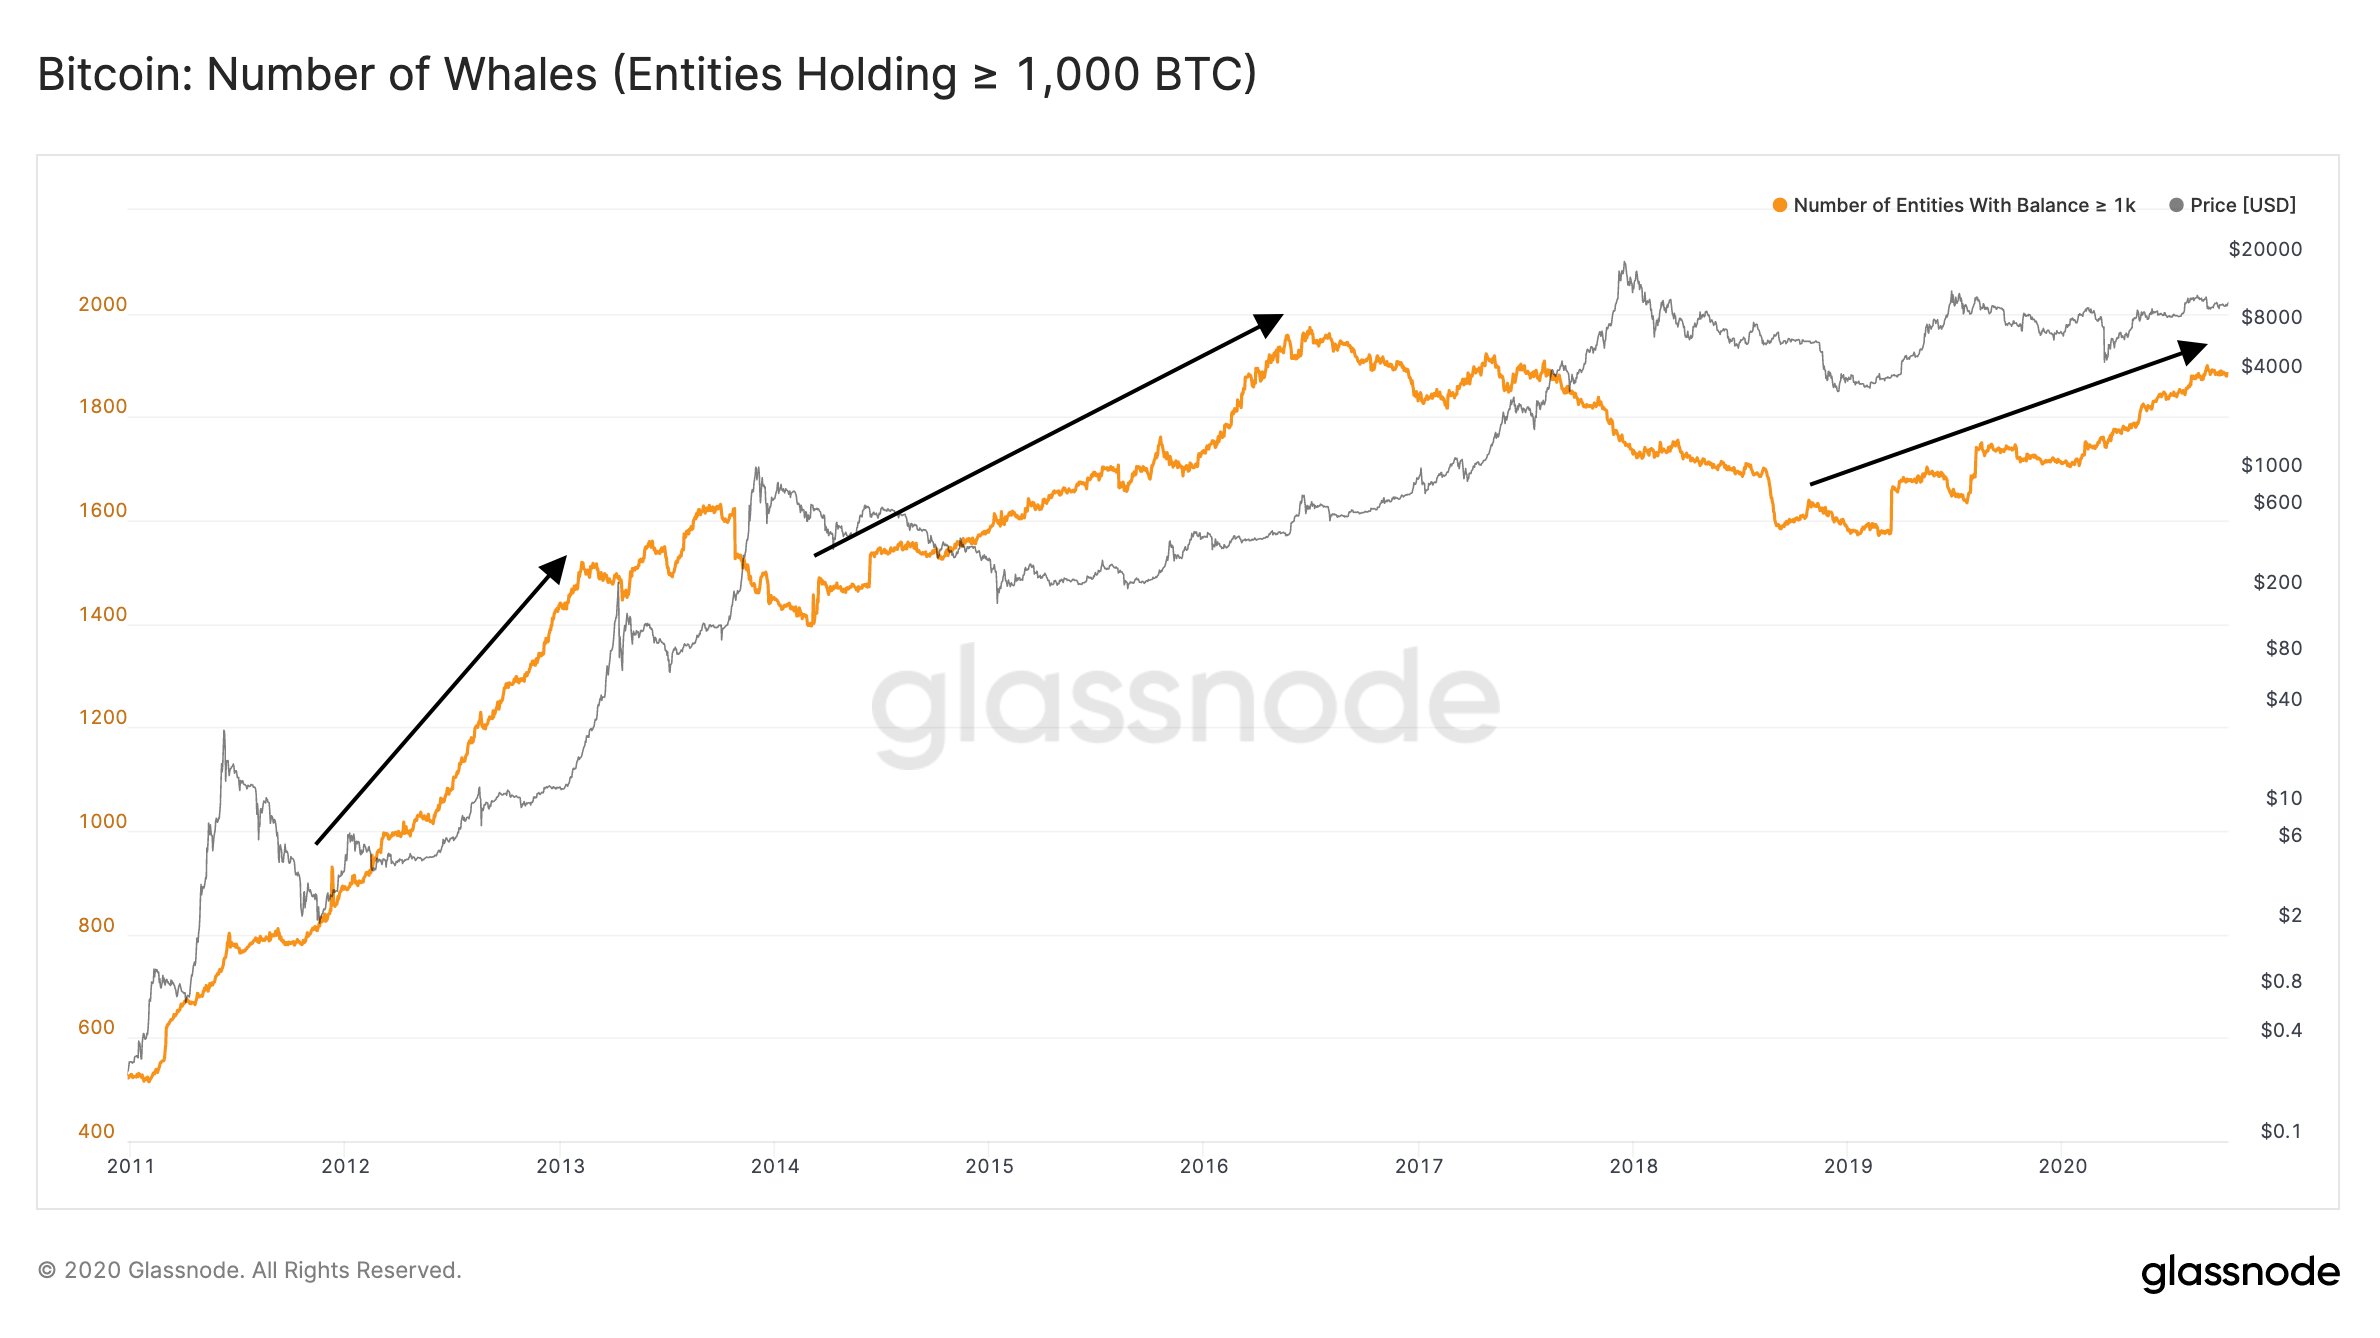
Chart of BTC's macro price action with number of whales overlay from Glassnode
Data from Coin Metrics also shows that there is a flurry of trends forming now that was last seen at the start of the last macro rally in late 2016 or early 2017. For one, Bitcoin’s Realized Cap “has been steadily increasing just as it did before the 2017 bull market took off. If it continues as it did in 2017, 2021 should be an interesting year.”
Featured Image from Shutterstock
Price tags: xbtusd, btcusd, btcusdt
Charts from TradingView.com
Bitcoin Surged 80% Last Time This Signal Appeared. It's Almost Back

Bitcoinist.com is author of this content, TheBitcoinNews.com is is not responsible for the content of external sites.
Our Social Networks: Facebook Instagram Pinterest Reddit Telegram Twitter Youtube


