


Cardano is experiencing a bull run and is targeting the $0.20 resistance level.
Stellar Lumens continues on its upward surge and is eyeing the $0.30 USD mark.
Cardano (ADA/USD)
Price Analysis
- High: $0.188139 USD
- Low: $0.168351 USD
- Major Resistance Level: $0.20
- Hourly MACD: Placed slightly in the Buy zone.
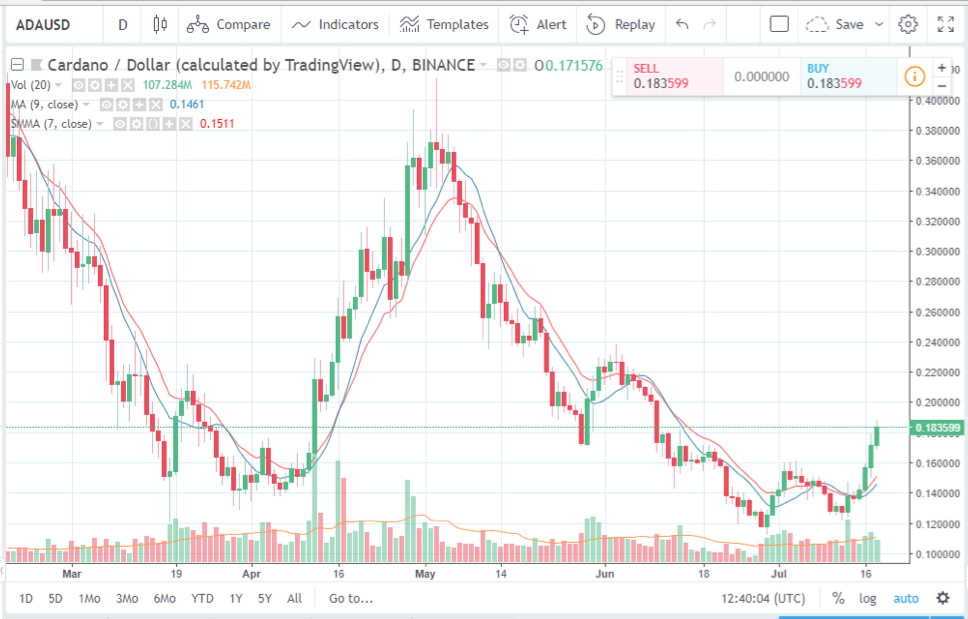
Cardano has been experiencing a bullish run again since 13th July. As can be observed from the ADA/USD trading chart, the price of the pair had largely experienced a bearish downtrend and had fallen below $0.12 USD at one point. At the time of writing, Cardano (ADA) is trading at $0.1835 USD approximately while the moving average (blue line) marks at 0.1461. This trading chart shows that on 16th and 17th July 2018, the ADA/USD pair had experienced a comparatively higher surge. Today too so far, the green candle seems to be gaining the bullish momentum. The pressure on the buyers is pushing the price up at the moment and had one point in this short timeframe had moved as high as $0.1869. Presently, the price has already tested the 23.6% Fibonacci retracement level during the rise from $0.1501 to $0.1869.
From the current price movements, it seems that Cardano (ADA) is strongly trying to make it to the resistance level at $0.20. The strong signs do not at the moment indicate that there is a chance of downward correction. The major support level can be said to be at $0.1780.
Stellar Lumens (XLM/USD)
Price Analysis
- High: $0.2945 USD
- Low: $0.2529 USD
- Major Resistance Level: $0.30
- Hourly MACD: Placed slightly in the Buy zone.
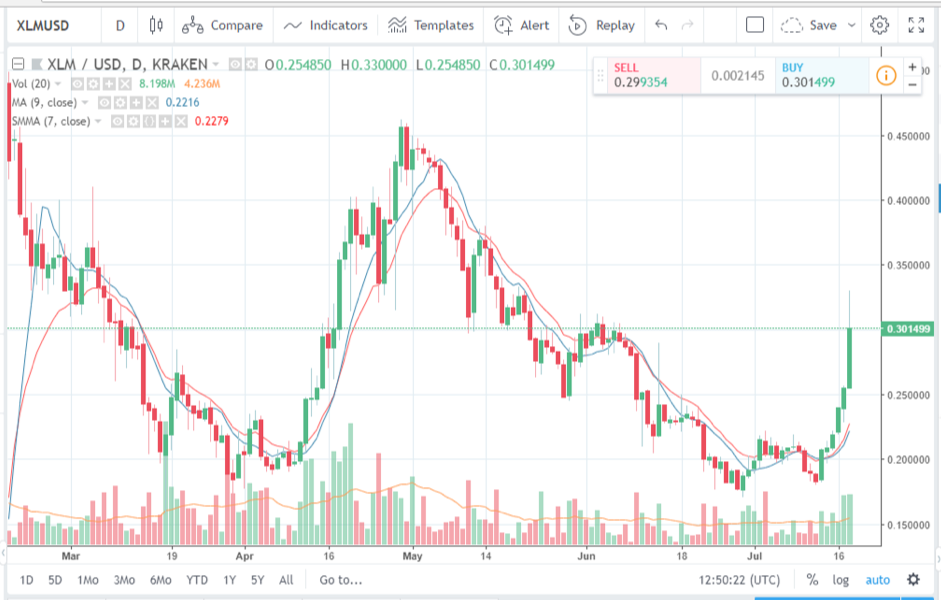
Stellar Lumens (XLM), like Cardano, has been showing stronger bullish signs since 13th July 2018. The daily range for the next day, as observed from the chart, shows it to be concise. However, if the pattern is followed then, a ‘steady’ upward movement is to be noted. The chart also shows that from 2nd May 2018, there has been a downtrend mainly. For some days in late May and early June, there had been a slight upsurge in the price action of the XLM/USD pair.
At the time of writing, the price of Stellar Lumens (XLM) shows approximately $0.3014 USD. The moving average marks 0.2216. This and the past few days green candles are creating a constant pressure on the buyers and keeping it in the Buy zone. If the situation continues to be the same for some time then, it can be expected that a much stronger bullish zone will be created on the XLM/USD chart. At the moment, the hourly MACD is placed in the Buy zone slightly but it may move into the zone strongly.
Currently, both Cardano (ADA) and Stellar Lumens (XLM) have been experiencing green signals and the present price action suggests that the trend may continue for some time. The BlackRock news seems to have had a much bigger positive effect as many cryptocurrencies are now sporting green.
Happy Trading~
For the latest cryptocurrency news, join our Telegram!
Disclaimer: This article should not be taken as, and is not intended to provide, investment advice. Global Coin Report and/or its affiliates, employees, writers, and subcontractors are cryptocurrency investors and from time to time may or may not have holdings in some of the coins or tokens they cover. Please conduct your own thorough research before investing in any cryptocurrency and read our full disclaimer.
Image courtesy of Pexels
Charts courtesy of tradingview.com
The post Cardano (ADA) Stellar (XLM) Price Analysis: What’s Happening? appeared first on Global Coin Report.
Read more at https://globalcoinreport.com/cardano-stellar-price-analysis-whats-happening/

Globalcoinreport.com/ is author of this content, TheBitcoinNews.com is is not responsible for the content of external sites.
Our Social Networks: Facebook Instagram Pinterest Reddit Telegram Twitter Youtube


