


Recent action has reintroduced a sense of vulnerability for a number of large market cap coins, including the two that we are going to look closely at today – EOS and Litecoin (LTC).
After a month of strength and seeming resiliency in a number of different coins across the cryptocurrency complex, we have moved to a stage where many charts are beginning to probe key support levels that hold the potential to signal either a trapdoor and a swift break to new lows or a reaffirmation of sturdy support and the potential for a base from which to reverse course back to the upside.
This dynamic is apparent in the two charts below.
EOS
Price Analysis
- High: $7.3171
- Low: $6.9056
- Major Resistance Level: $7.30
- Hourly MACD: Rolling Over
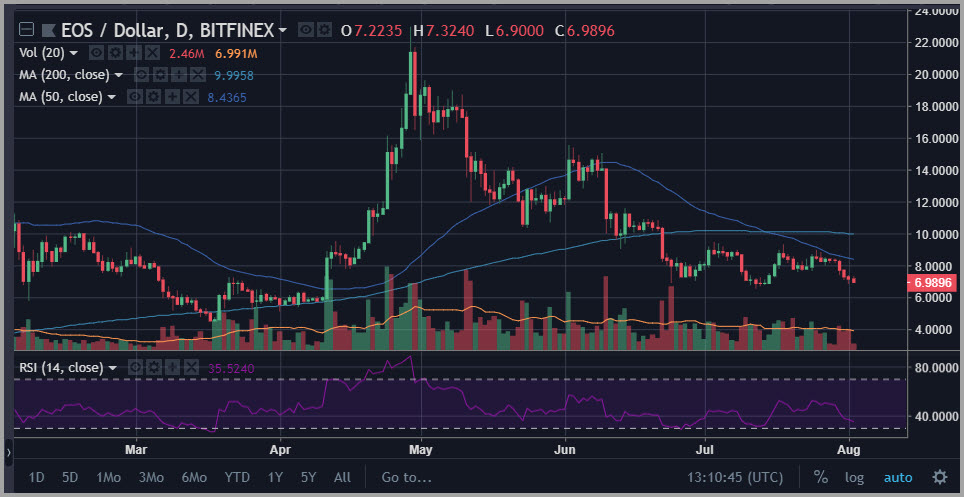
EOS spiked lower last night to probe critical support at the $6.84 area. That support level held once again and drove the coin back up to reestablish itself above the $7 area.
If EOS is able to hold this zone of support and move back higher to test recent range highs, a powerful test of resistance lies above where we see a confluence between the 50-day and 200-day simple moving averages, both in place right around the $8.50 level.
In other words, if EOS is able to fend off sellers and maintain its recent support levels, and then reverse ground and move back higher, a massively important breakout potential could be just around the corner.
But it has to prove itself once again first.
Litecoin (LTC)
Price Analysis
- High: $78.523
- Low: $76.079
- Major Resistance Level: $78.25
- Hourly MACD: Rolling Over
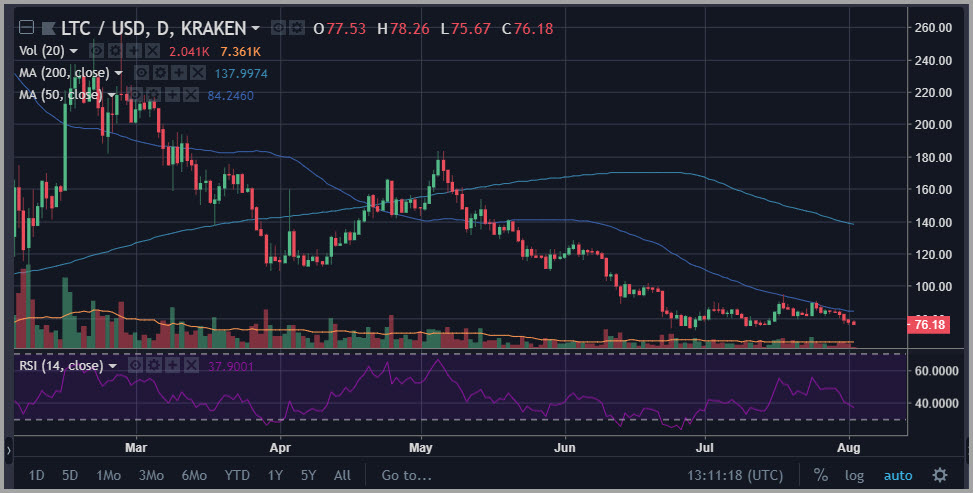
Litecoin (LTC) has tested and reaffirmed key support in the $76.25 area 3 times in the past 36 hours. That represents a strong response to a tremendous amount of pressure.
If you pan back and look at the very long-term chart for Litecoin (LTC), the zone between $75 and $95 is a defining area. It first played important resistance back in August and September 2017. And then it played both resistance and then support in November and December 2017, acting as the trigger point for the massive breakout and run higher than we saw during the mania period to close out last year.
Now, it is playing both roles for the Litecoin (LTC) chart – with key resistance stepping in above the $90 area and key support stepping in below the $75 area.
During the recent range, we have seen bullish divergences in major oscillators such as the 14-day RSI, possibly pointing to a growing potential for this to turn into a meaningful base on a break back higher through that range resistance level, which would also represent a breakout above a declining 50-day simple moving average.
Happy Trading~
For the latest cryptocurrency news, join our Telegram!
Disclaimer: This article should not be taken as, and is not intended to provide, investment advice. Global Coin Report and/or its affiliates, employees, writers, and subcontractors are cryptocurrency investors and from time to time may or may not have holdings in some of the coins or tokens they cover. Please conduct your own thorough research before investing in any cryptocurrency and read our full disclaimer.
Image courtesy of Pexels
Charts courtesy of tradingview.com
The post EOS Litecoin (LTC) Price Analysis — Fending Off the Attack appeared first on Global Coin Report.
Read more at https://globalcoinreport.com/eos-litecoin-ltc-price-analysis-fending-off-the-attack/

Globalcoinreport.com/ is author of this content, TheBitcoinNews.com is is not responsible for the content of external sites.
Our Social Networks: Facebook Instagram Pinterest Reddit Telegram Twitter Youtube


