


Recent action has clearly been brutal for many different large market cap coins that define any trader’s rough and ready perception of the cryptocurrency complex as a whole. But our task as technical analysts is to remain dispassionate and empirical in our observations. And let the charts tell the story.
Today, we’re going to dive into that story for EOS and Stellar (XLM), and see what we find.
EOS
Price Analysis
- High: $5.1534
- Low: $4.9654
- 24-Hour Volume: $638.42M
- 7-day Percent Change: -28.15%
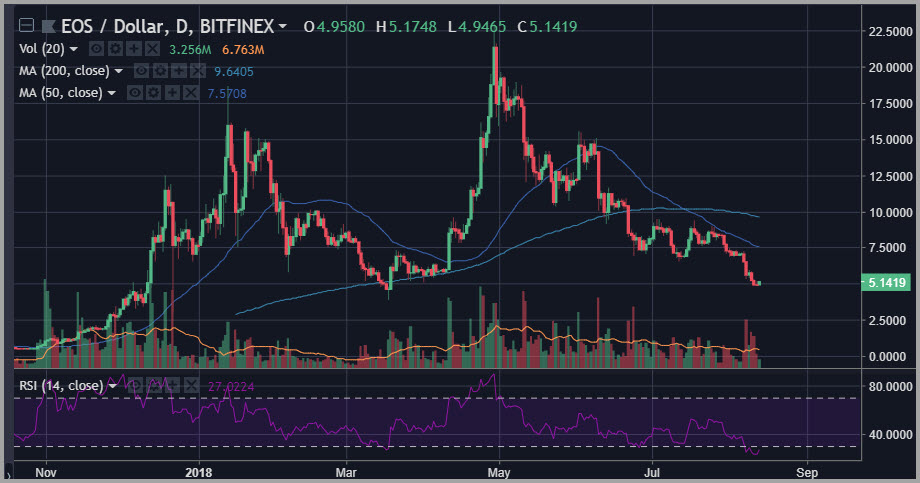
EOS has been one of the most brutalized of all the large market cap coins over the past seven days, declining nearly 30% in that time, and breaking a number of key support levels on the way.
However, one interesting technical development that we’ve seen pop up over the past 48 hours is a very clear bullish divergence on the hourly MACD indicator readings, with two higher lows amid lower lows on the price chart for EOS.
This type of bullish divergence often signals a gradual reversal of momentum going on under the surface of the chart, which then becomes manifest in terms of price action.
The jury is still out as to whether or not we will see this blossom, but it’s definitely something to watch out for given that EOS has actually been a relative outperformer over the past 12 months.
Stellar (XLM)
Price Analysis
- High: $0.2431
- Low: $0.22325
- 24-Hour Volume: $70.65M
- 7-day Percent Change: -8.55%
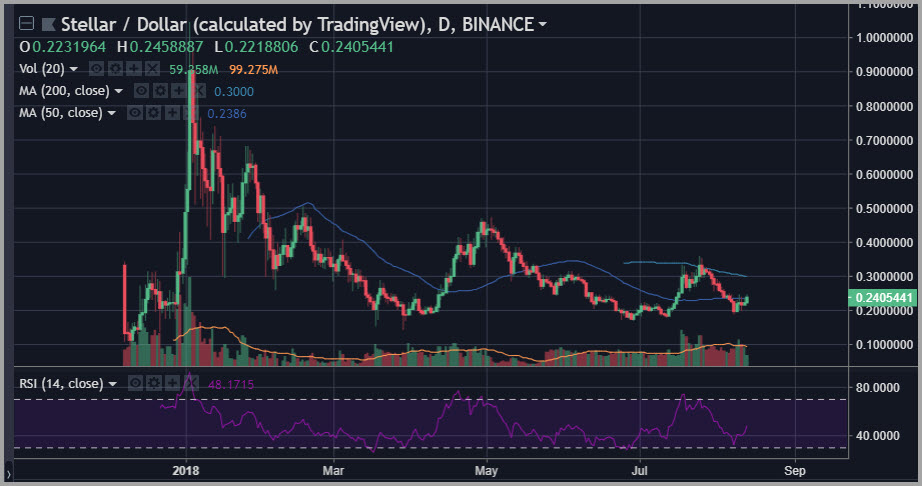
While EOS has been an outperformer over the last 12 months, Stellar (XLM) has been an outperformer over the last two, still trading now above both its June lows and late March lows.
There are only a few large market cap coins that can make this claim, which unequivocally places it within the top echelon in terms of performance – as dreary as that statement actually is when you look at this chart.
As far as shorter time frame signals go, Stellar (XLM) is also showing something of a bullish divergence on the hourly chart where major oscillators are concerned, with both the 14-period RSI and the hourly MACD signaling some reversal of momentum underneath the surface that may become manifest in price action.
However, I am always a little uneasy about calling even a short-term bottom in a coin that has brushed so close to a major stop-loss level without triggering those weak-handed orders. It would be nice to see XLM dive quickly under the $0.20 level before finding support and turning back higher.
Happy Trading~
To trade cryptocurrencies, sign up with Binance!
Disclaimer: This article should not be taken as, and is not intended to provide, investment advice. Global Coin Report and/or its affiliates, employees, writers, and subcontractors are cryptocurrency investors and from time to time may or may not have holdings in some of the coins or tokens they cover. Please conduct your own thorough research before investing in any cryptocurrency and read our full disclaimer.
Image courtesy of Pexels
Charts courtesy of tradingview.com
The post EOS Stellar (XLM) Price Analysis: The Technical Story appeared first on Global Coin Report.
Read more at https://globalcoinreport.com/eos-stellar-xlm-price-analysis-the-technical-story/

Globalcoinreport.com/ is author of this content, TheBitcoinNews.com is is not responsible for the content of external sites.
Our Social Networks: Facebook Instagram Pinterest Reddit Telegram Twitter Youtube


