


Given the indisputable bear cycle that we have witnessed in the crypto complex for essentially the entirety of 2018, and given the relatively sparse options that traders have at hand to take advantage of short side strategies in this asset class, generally speaking, the game that most everyone is playing here has something to do with market timing around a bottom-picking strategy.
Bear markets make bottoms by exhausting a supply of sellers. It’s a process that is about gauging the “lean” of the marketplace across a number of time frames. For both Ethereum (ETH) and Bitcoin Cash (BCH), we see this process as potentially nearing that golden inflection point. As such, our goal today is to examine the charts for these two coins with the objective of scenario-building based on years of experience across many different assets given the technical picture often involved in defining major turning points.
Ethereum (ETH)
Price Analysis:
- High: $445.98
- Low: $429.00
- Major Resistance Level: $500
- Hourly MACD: Steady Downside Momentum
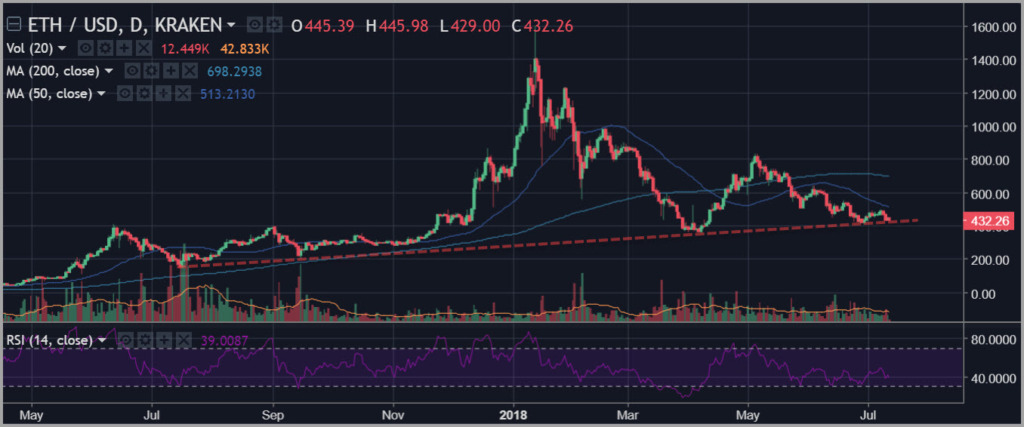
Ethereum (ETH) continues to evidence the modal character of a downward trending market on multiple time frames. But, over the course of the trend from the early May highs to its present position probing support near the 400 level, we can begin to understand some of the ways in which this market might play out a type of capitulatory purge that may well represent the impetus for a consensus lean necessary to mark out conditions consistent with a cycle low scenario.
The idea here is about constructing a reasonable hypothesis about a broad psychological “give up” point. In other words, what would this market have to do to make current “fast money” longs jump ship and give up?
It may well be that this is exactly what is necessary to exacerbate the downside enough to mark out a capitulatory low that could be highly valuable as an entry point for prospective bulls waiting in the wings.
Based on the image above, we can see a trend line that connects the lows from 2017 during the summer with the lows logged in late March and early April. The simultaneous break below this trend line, that would no doubt also represent a break underneath the critical $400 level, might well force current holders of this coin to capitulate and throw in the towel, thus exacerbating the downside movement to a point beyond its natural inflection level.
If we see such a market event, and if it comes on above-average volume over the course of several days, one should be watching this coin closely for an immediate snapback or rebound that suggests that the overshooting dynamic has blossomed and played out, thus creating the potential for a patiently earned low-risk speculative entry point with a fixed point of risk at the lows of the capitulatory spike.
Bitcoin Cash (BCH)
Price Analysis:
- High: $706
- Low: $673.8
- Major Resistance Level: $1000
- Hourly MACD: Steady Downside Momentum
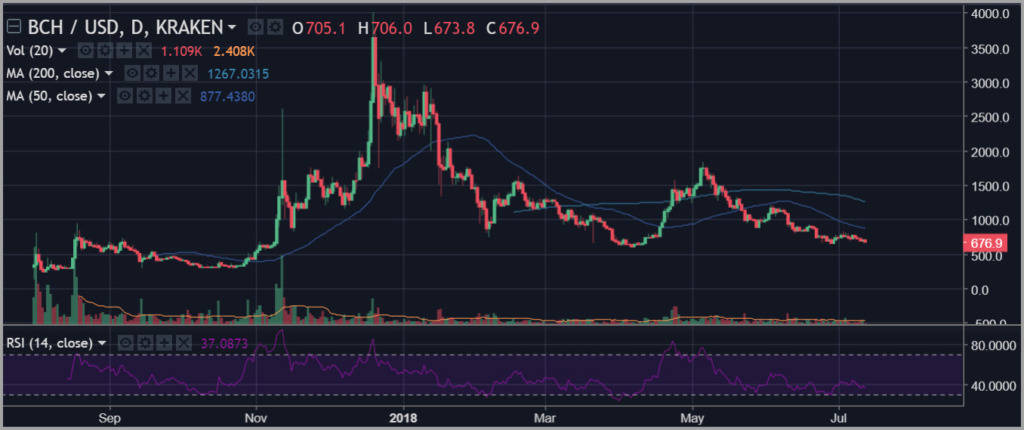
Bitcoin Cash (BCH) is actually in a very similar technical posture to Ethereum (ETH). In this case, with BCH, the key level to watch is at $600.
Here as well, we see a recent and persistent downward trend from late April and early May that has led to a retest of lows logged right around the end of the first fiscal quarter. To further highlight the similarities, there is an important trend line in play here as well, but this one has already been broken, suggesting this decline is in a more advanced phase.
While the correlations between the two, and between both of these and the larger cryptocurrency complex, are clearly dramatic and profound, the fundamental precepts of technical analysis suggest that that’s no excuse for diligent study of the action on the chart.
We often see dynamics that may be explained away by larger asset class phenomena, but that also contain important nuances. And in the case of these coins, the inherent volatility within their localized patterns is great enough that any edge can produce enormous and even game-changing differences for traders positioning themselves here.
However, with Bitcoin Cash (BCH) – as with Ethereum (ETH) – the trend remains to the downside suggesting the importance of an opportunistic and patient approach. This implies the importance of watching for overly dramatic movement to assign some degree of probability to an opportunity to play countertrend.
In this case, one may be wise to wait for a new all-time lows print on oscillators such as the 14-day RSI, confirming the sense that the extremes of selling represent an aberration from typical statistical assumptions.
Happy Trading!!
For the latest cryptocurrency news, join our Telegram!
Disclaimer: This article should not be taken as, and is not intended to provide, investment advice. Global Coin Report and/or its affiliates, employees, writers, and subcontractors are cryptocurrency investors and from time to time may or may not have holdings in some of the coins or tokens they cover. Please conduct your own thorough research before investing in any cryptocurrency and read our full disclaimer.
Image courtesy of Pexels
Charts courtesy of tradingview.com
The post Ethereum (ETH) Bitcoin Cash (BCH) Price Analysis – Scoping Out a Capitulatory Opportunity appeared first on Global Coin Report.

Globalcoinreport.com/ is author of this content, TheBitcoinNews.com is is not responsible for the content of external sites.
Our Social Networks: Facebook Instagram Pinterest Reddit Telegram Twitter Youtube


