

In the last few articles, we’ve been analyzing Bitcoin’s bullish move by studying momentum indicators, the bullish channel, and the subsequent trend lines.
In this article, we’ll analyze how Ethereum as represented by Ether or ETH has fared during Bitcoin’s rise. Our analysis will center around spotting the trends in the market and identifying the signals of changing momentum. We’ll also highlight the levels where buy and sell orders might be located. If these orders are triggered and there’s a tailwind of momentum behind them, explosive moves are often the result.
The recent rise in virtual currencies has boded well for those investing in Ether, Litecoin, and Bitcoin including the Bitcoin Investment Trust (OTCQX:GBTC) or following the ongoing developments of the first Bitcoin ETF through the Winklevoss Bitcoin Trust ETF (Pending:COIN).
Unlike Bitcoin, Ether wasn’t designed as a global digital currency. Instead, it was meant to pay for specific transactions on the Ethereum blockchain network. However, Ether has been traded as a cryptocurrency similar to Bitcoin and Litecoin. In this article, we’ll refer to Ether and Ethereum as interchangeable for the ease of discussion.
Ether still recovering from China’s ICO ban:
- We can see from the chart below that ETH took a hit like Bitcoin and fell in September where it bounced off the bottom trend line (purple line).
- However, we can see the reversal candles (yellow circles) and signal that buying interest may be returning to send Ethereum higher.
- Reversal candles are significant because they represent trading behavior whereby sellers sold ETH, pushing it down, but buyers rushed in and bid up ETH thus forming the white wick.
- The reversal candles line up nicely with the purple trend line where we’re seeing higher lows which is a bullish sign. Unfortunately, we’re not seeing higher highs yet which are necessary for an uptrend.

Contrasting Ethereum to Bitcoin:
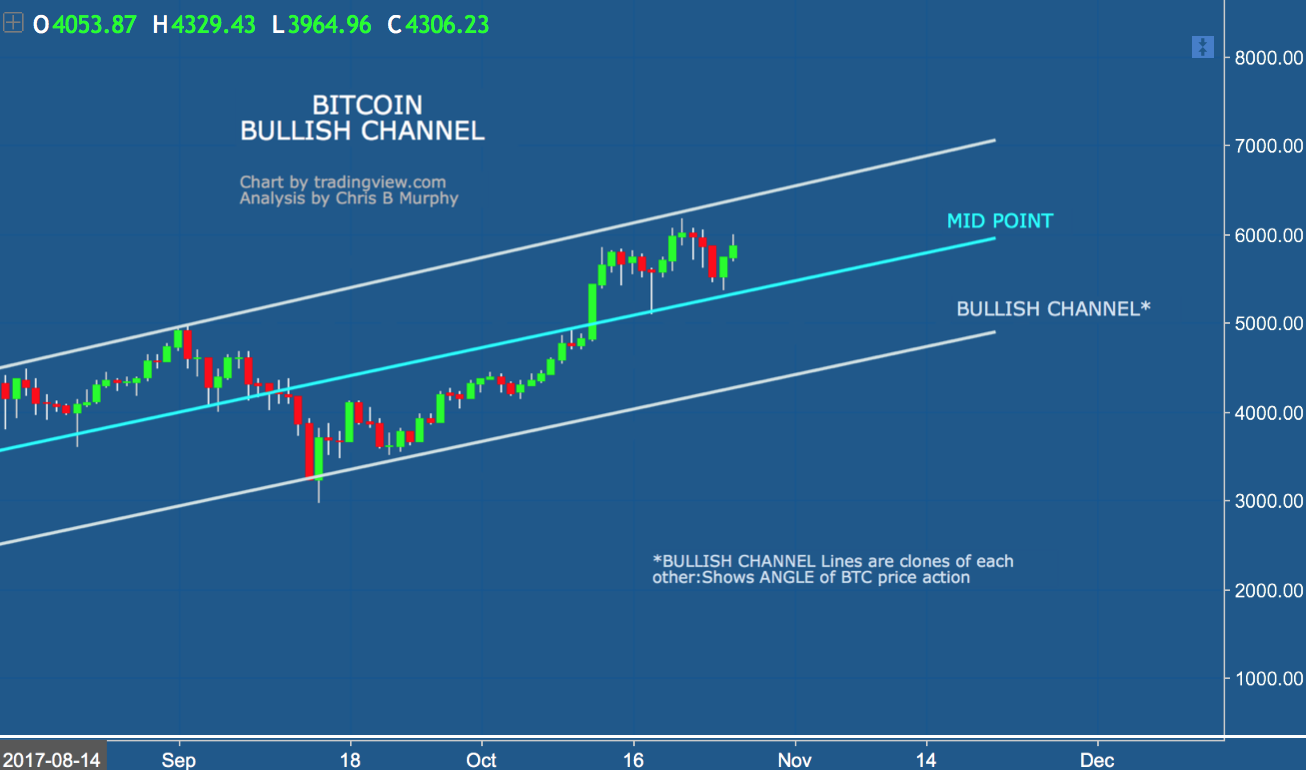
- We can see how BTC has recovered from the ICO ban and has put in higher lows and higher highs as it marches up the bullish channel.
- If you notice, BTC is above the midpoint line, while ETH has yet to break and hold above its midpoint (in the previous chart).
Momentum as measured by MACD:
- Below is a momentum chart for ETH. We can also see the down move in momentum occurred in September was mostly from the ICO ban and not due to ETH itself.
- The good news for ETH bulls is that momentum has been rising steadily as seen by the blue arrow since the original down move.
- Also, and it may be tough to see on the chart, the MACD moving average lines broke above zero this month. This break is a bullish signal, albeit an early signal.
- However, ETH will need to break above the green line to rally higher (green arrow). In my opinion, the momentum in ETH shows that investors remain cautious and perhaps are nervous that another country might ban ICOs or cryptocurrencies in general.
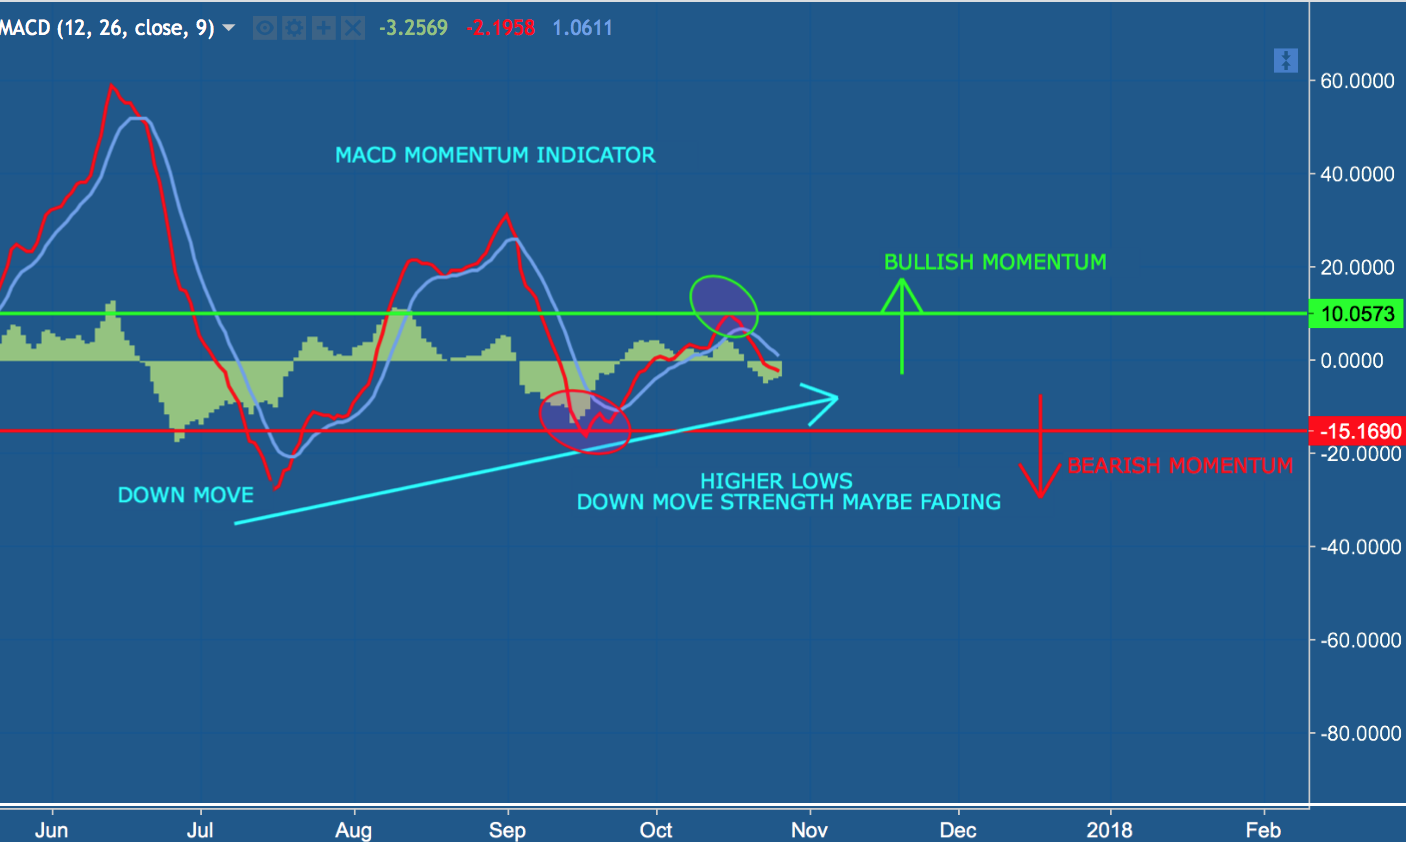
Chart from tradingview.com and analysis by Chris B Murphy.
If you follow my articles on Seeking Alpha, you know that I believe traders place buy and sell orders around trend lines to either go long or short or to trigger stop-loss orders or take-profit orders. When these orders are triggered, the move is exacerbated in the direction of the break and can result in huge momentum moves.
Levels to watch:
On the chart below, we can see some of the key levels in price or where traders may have buy and sell orders placed for ETH.
- The key Fibonacci levels are highlighted to show where ETH might hit resistance or break out during another move higher. The Fibonacci levels are percentages representing extensions of the rally from July to early September and where buy and sell orders might be located.
- The first level needed to break above is $345 as highlighted with the orange line. A break of $345 should push ETH to test the purple trend line at the $400 mark. If you recall, ETH lacks higher highs and above $345 would help in this regard.
- On a break higher above $390 to $400 (green line), $440 to $450 comes into play as buy orders should kick in.
- Please note, on breaking above $400, ETH will need to hold for several days above $400, before pushing higher. Please watch for false breaks.
- On a break above $440 to $450 or the 144% extension level (yellow line), $520 comes into play as the market might try for the 192% Fib extension level of the July-to-September rally.
- In my opinion, $440 to $520 are probably medium- to long-term targets unless we see a surge in momentum for Ethereum and other cryptos.
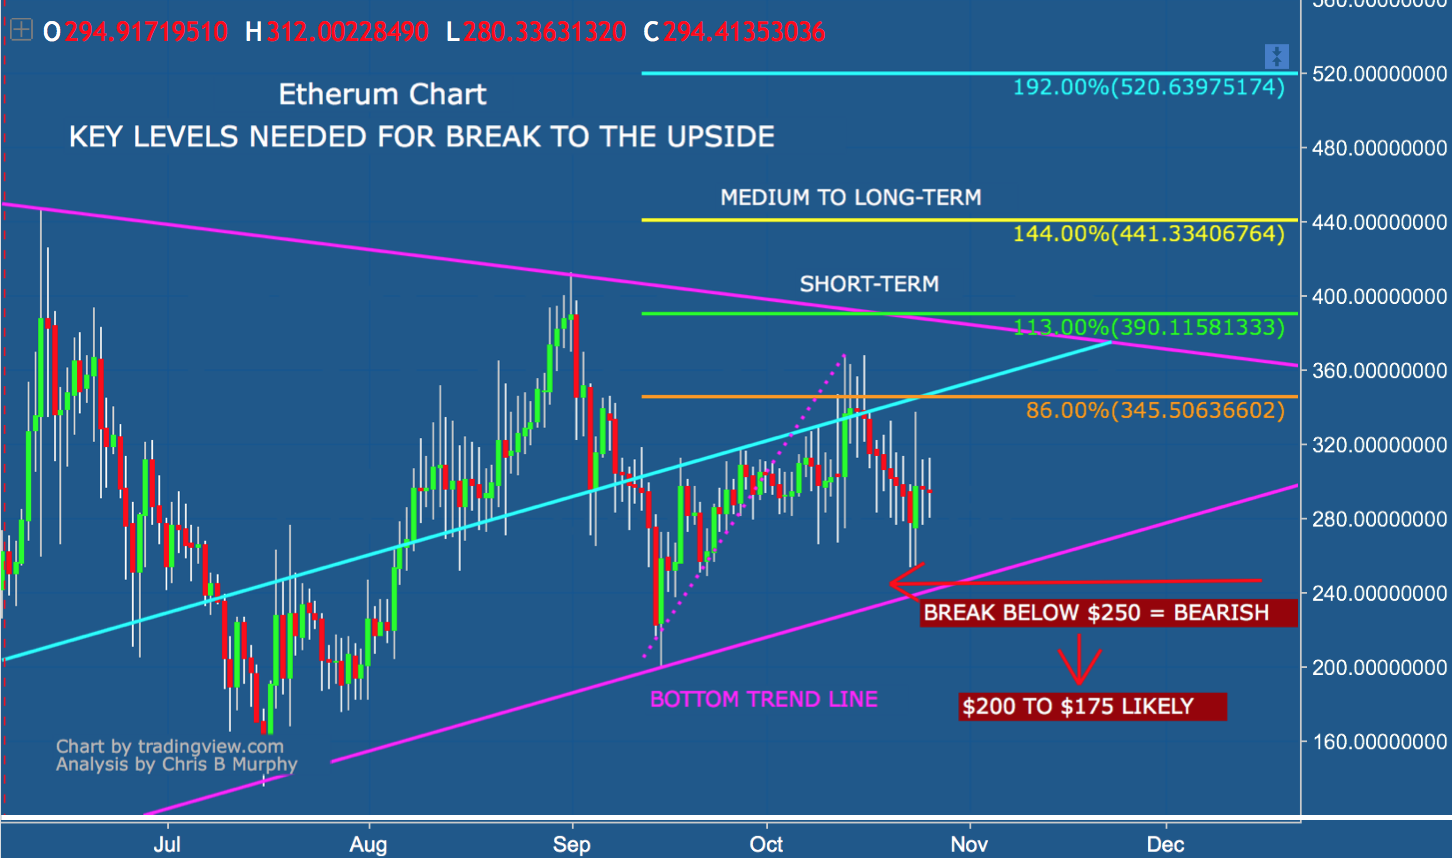
- On a bearish break of $250, there are likely to be a number of sell orders in this zone. The sell orders if triggered will likely exacerbate the move lower and possibly push ETH to the $200-to-$175 zone.
Takeaways:
- My take is that the bullish trend remains in place as long as ETH remains above the purple trend line. ETH may not break much higher, but instead grind higher and trade between the midpoint line (light blue line) and the bottom purple trend line. As a result, Ethereum may go higher, but not in the same fashion as Bitcoin.
- Overall, I believe blockchain technology has garnered more investment and favor from central banks lately. As a result, Ethereum and Bitcoin should benefit. However, the long-term value of ETH is still to be determined as the market continues to determine how cryptos fit within the financial system.
In the coming days, I’ll have more analysis or news as it develops. Please become an “email alert” follower to have my next article and charts emailed to you once they’re published (see below). Thanks for reading.
Good luck out there.
Author’s note: If you like this article and would like to receive email alerts stay up to date on the markets, cryptocurrencies, banks, equities, forex, and commodities, please click my profile page, and click the “Follow” button next to my name, and check “Get email alerts” to receive these articles sent via email to your inbox.
You can also find the “Follow” button at the top of this article next to my name. And of course, feel free to comment below if you have any questions, or send me a private message by clicking the “send a message” link on my profile page.
Disclosure: I/we have no positions in any stocks mentioned, and no plans to initiate any positions within the next 72 hours.
I wrote this article myself, and it expresses my own opinions. I am not receiving compensation for it (other than from Seeking Alpha). I have no business relationship with any company whose stock is mentioned in this article.
Our Social Networks: Facebook Instagram Pinterest Reddit Telegram Twitter Youtube


