


Long-Term Outlook
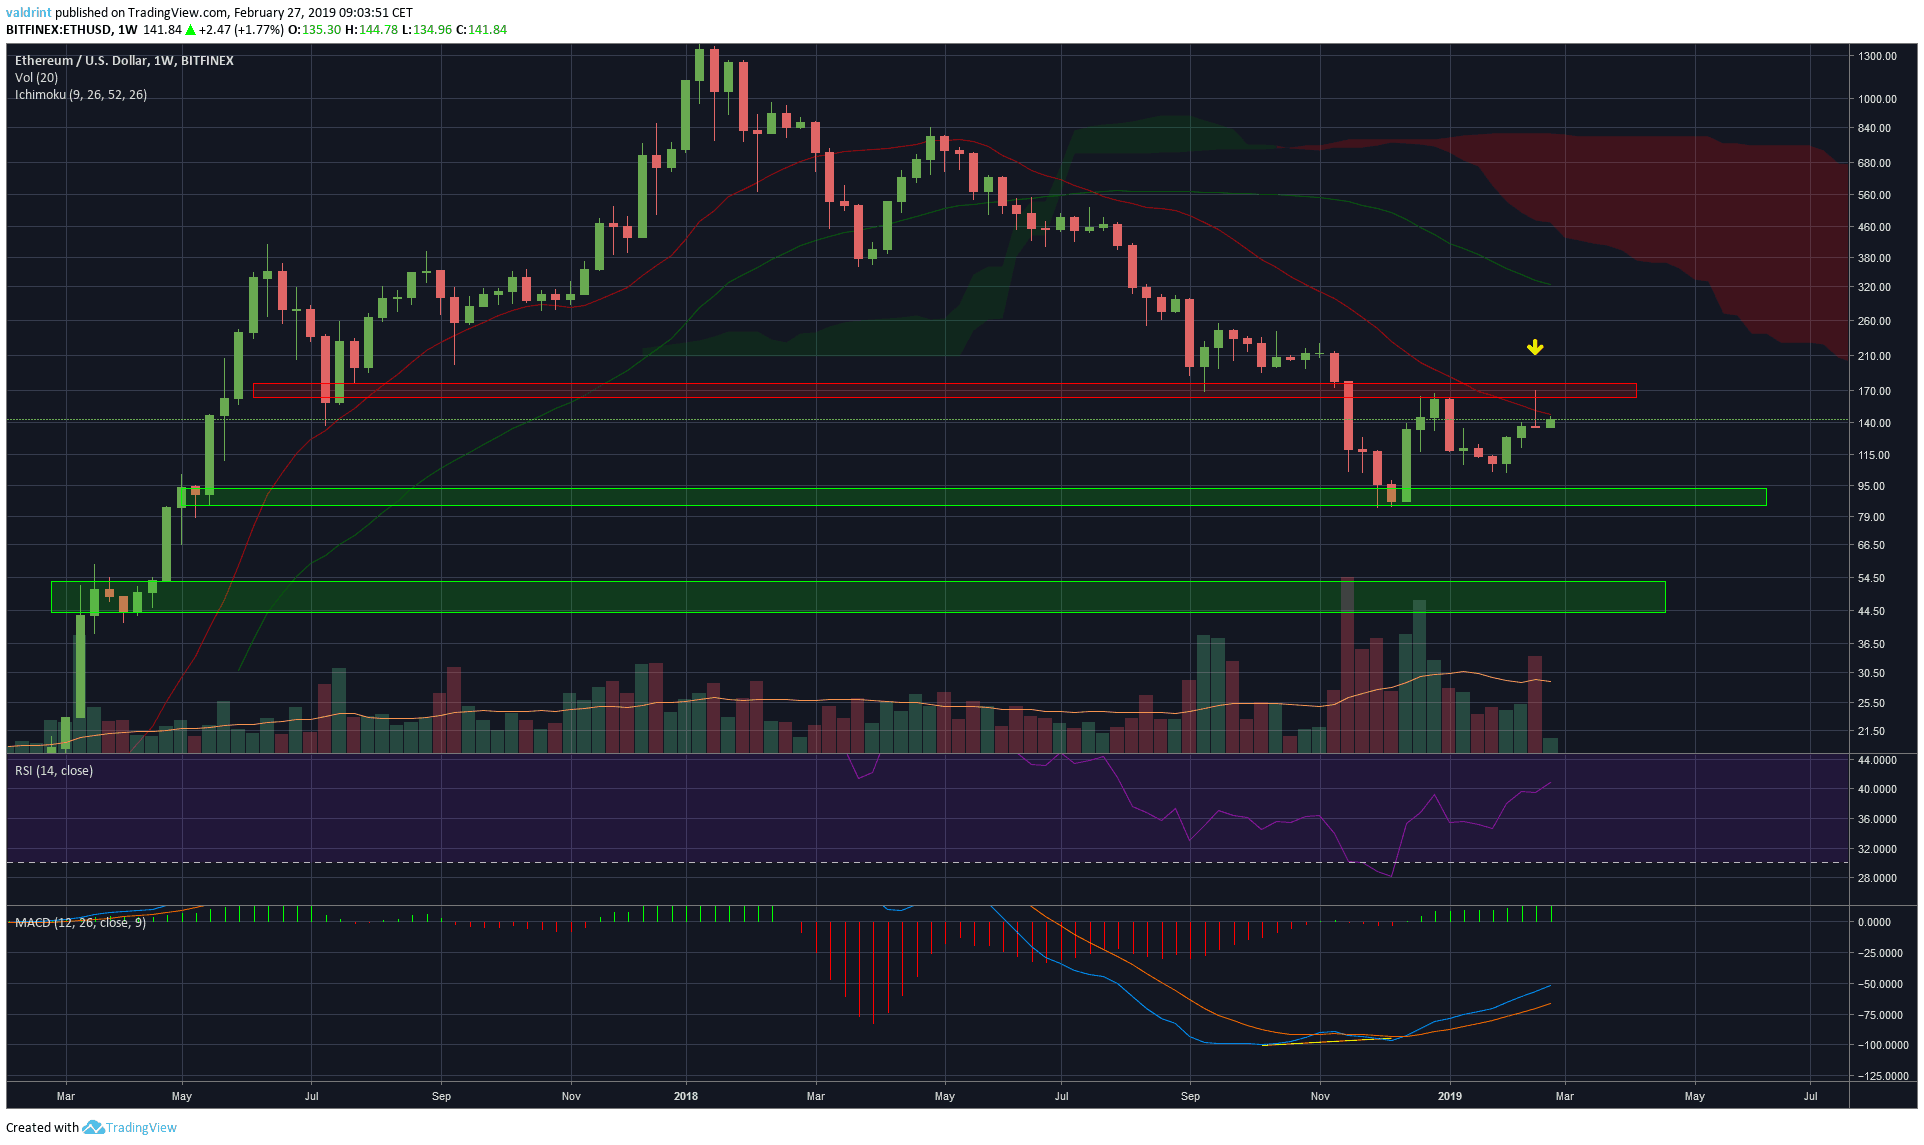
Ethereum Weekly Logarithmic Chart – Source: Tradingview.com
A look at the Ethereum Weekly logarithmic chart shows that the price made a temporary bottom at $80 inside the minor support area, before starting an upward move.
However, once reaching the minor resistance is at $160, it was rejected and formed a hammer candle (yellow arrow), which when found on uptrends usually indicates a reversal.
It is worth noting that this is the 3rd time that price got rejected by the 21-period MA. Price is trading below the 21/50-period MAs and the Ichimoku cloud.
The RSI is at 40, indicating neither oversold nor overbought conditions.
On a more positive note, the MACD is moving upward with strength but is not positive yet.
Given this information, I am undecided/leaning on bearish in the long-term.
Medium-Term Outlook
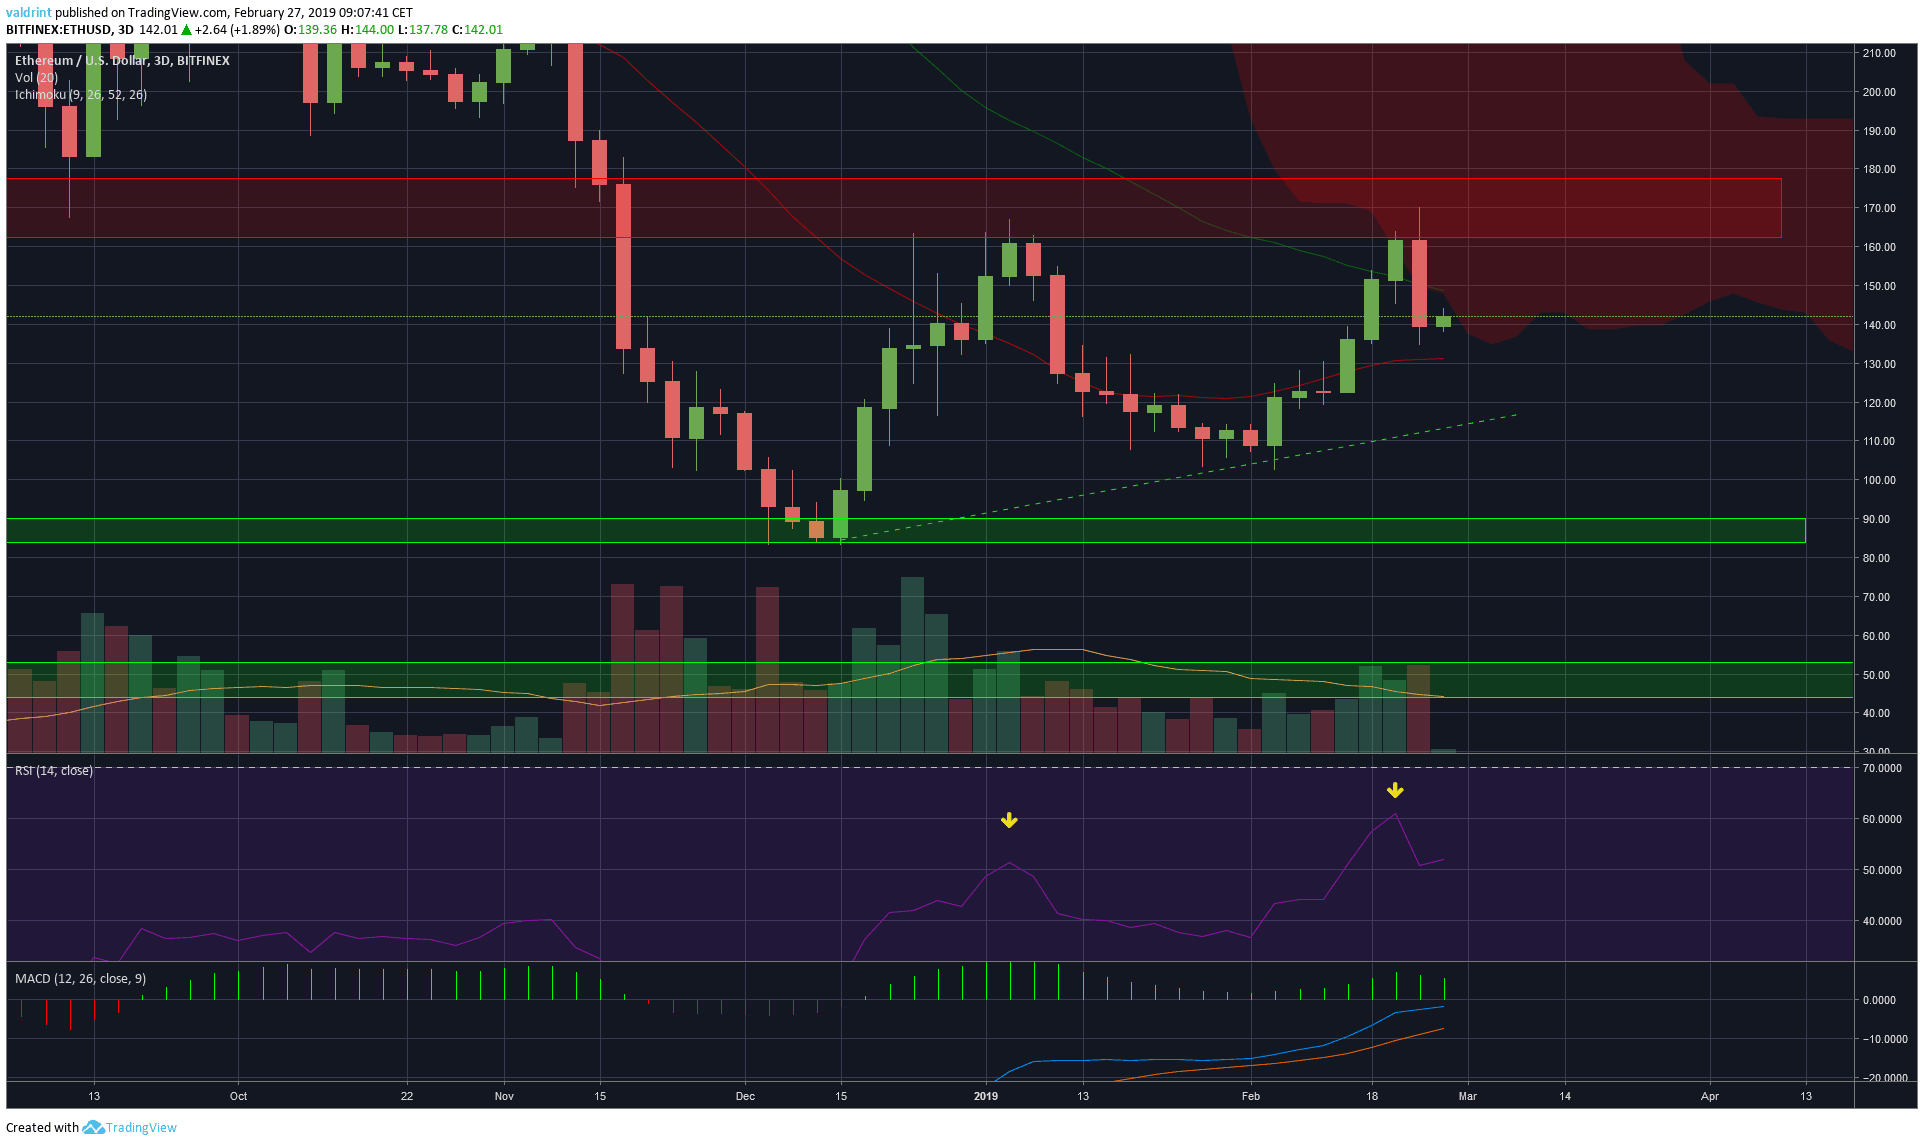 Ethereum 3-Day Chart – Source: Tradingview.com
A look at the 3-day chart shows that price is trading above the 21, but below the 50-period moving average and the Ichimoku cloud.
Furthermore, the price is following a possible ascending support line which has however only been validated twice.
The support line is currently at $120. We can see that after reaching the edge of the Ichimoku cloud, price formed a double top and made a bearish engulfing candle.
The MACD tried to move into positive territory but was rejected and has lost most of its power.
On a more positive note, the RSI is higher in the second instance of the double top, indicating strength.
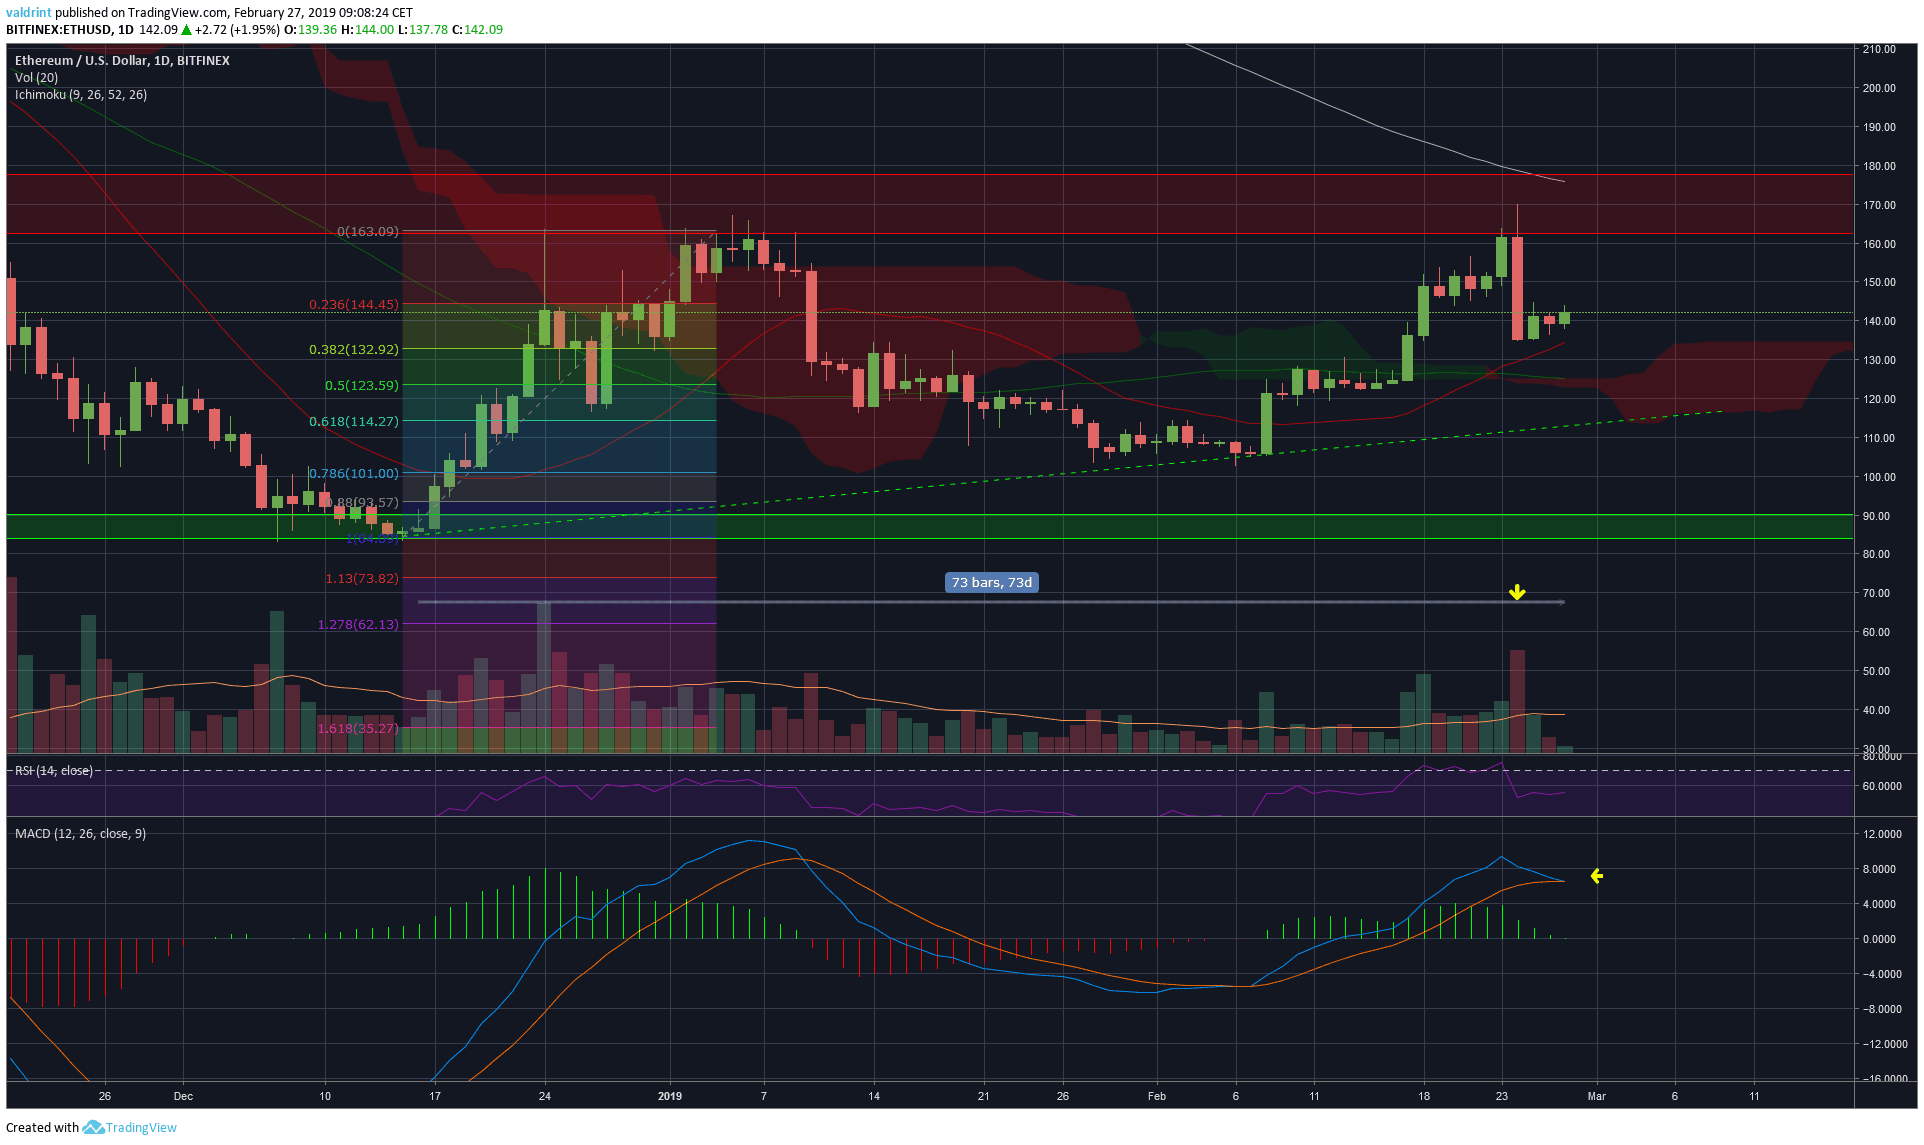 Ethereum Daily Chart – Source: Tradingview.com
A look at the Daily chart shows that price also got rejected by the 200-period moving average.
Price is currently trading above the Ichimoku cloud and has found support above the 21-period MA, which has made a bullish cross.
Price is close to the 0.382 fib line of the entire upward move.
We can also see that the support line has been in place for 73 days.
Given this information, I am bearish on the medium-term.
Short-Term Outlook and Price Prediction
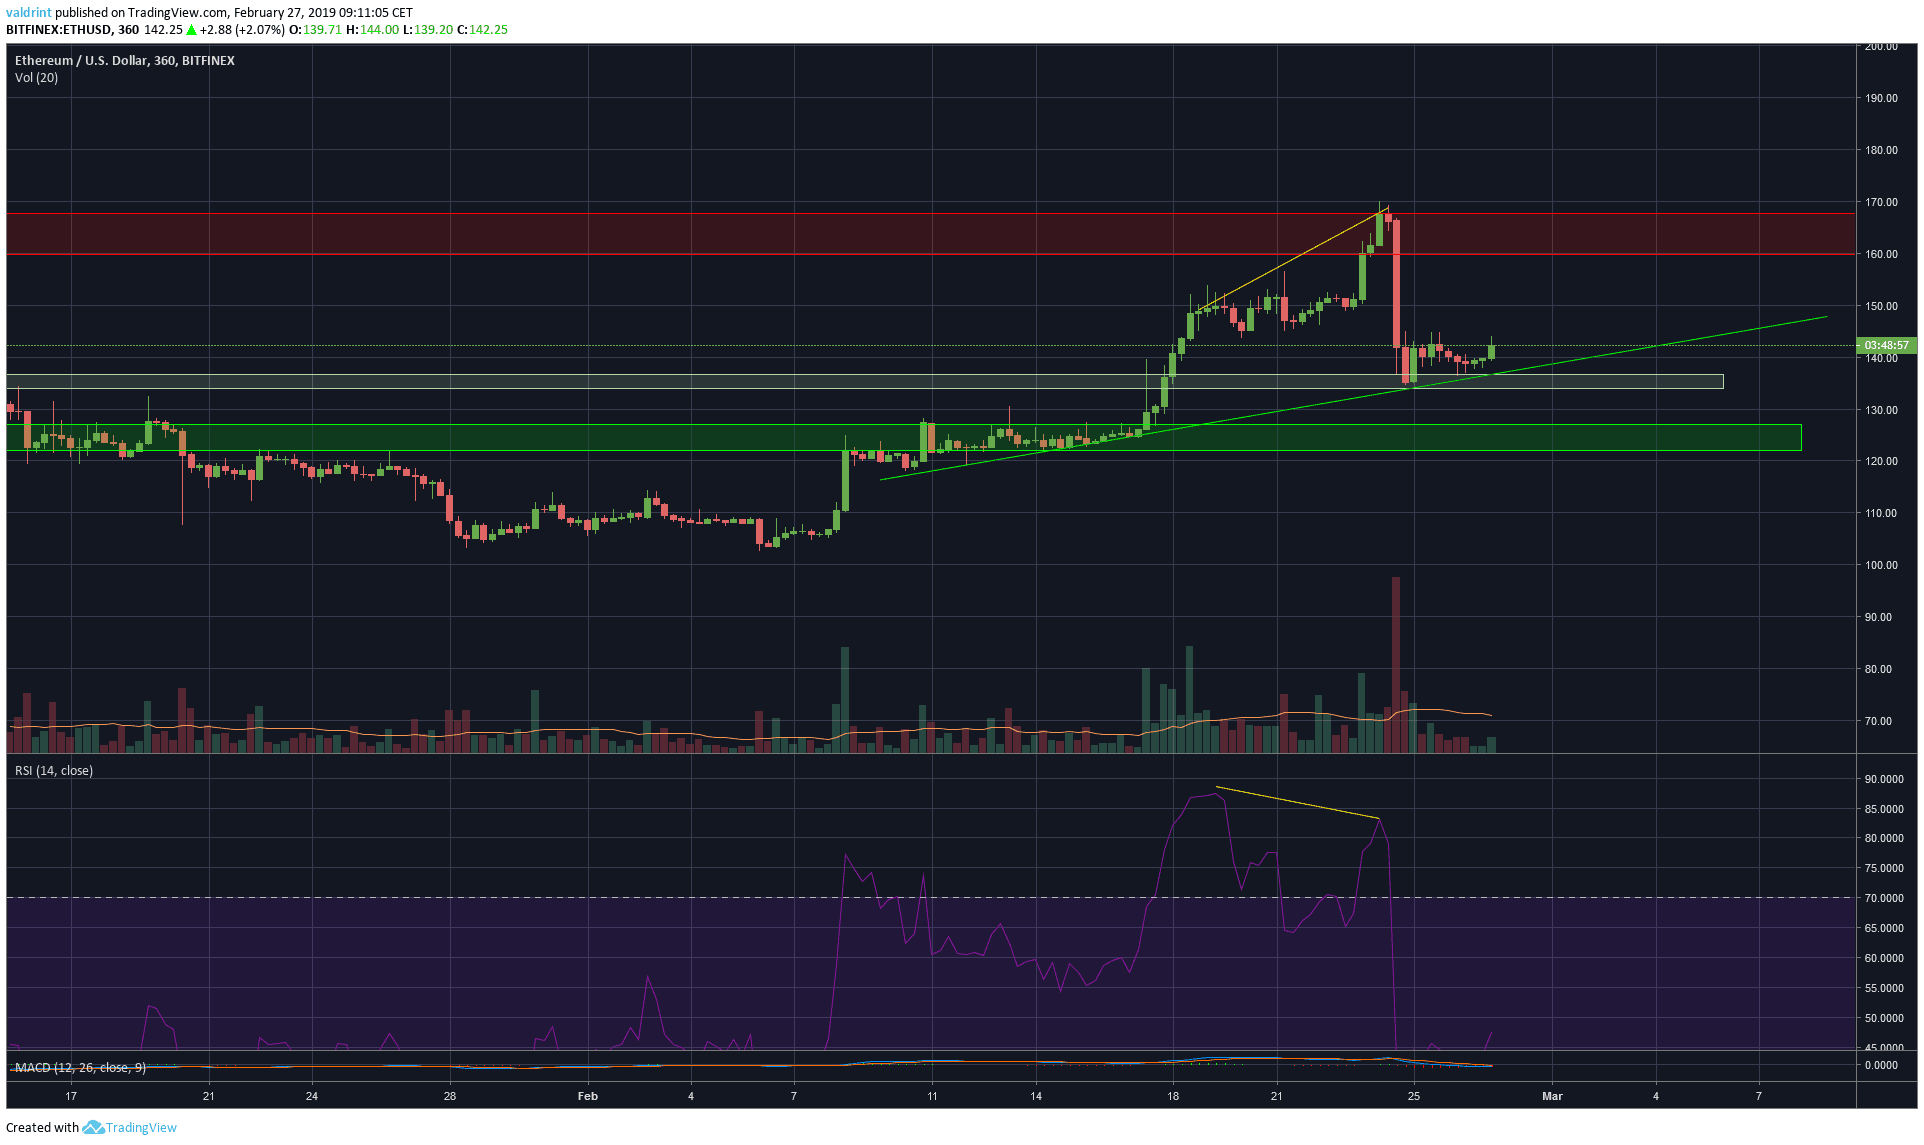 Ethereum 6-Hour Chart – Source: Tradingview.com
A look at the 6-hour chart shows us that price is following a short-term ascending support line that has been in place for roughly 17 days.
Furthermore, we can see that the drop in price was preceded by bearish divergence in the RSI.
The price fell back to the support line and the minor support area above $130.
Finally, the drop was made on significant volume.
Price Prediction:
I believe that during next week price will breakdown from the support line and drop to the support area at $120-$125.
Conclusions:
- Price failed to break above the 21-week moving average.
- Price made a double top.
- The drop was preceded by short-term bearish divergence.
Latest Ethereum News:
| DISCLAIMER: Investing or trading in digital assets, such as those featured here, is extremely speculative and carries substantial risk. This analysis should not be considered investment advice, use it for informational purposes only. Historical performance of the assets discussed is not indicative of future performance. Statements, analysis, and information on blokt and associated or linked sites do not necessarily match the opinion of blokt. This analysis should not be interpreted as advice to buy, sell or hold and should not be taken as an endorsement or recommendation of a particular asset. |
RELATED ARTICLES
MORE FROM OUR PARTNERS
Advertisement
blokt.com is author of this content, TheBitcoinNews.com is is not responsible for the content of external sites.
Our Social Networks: Facebook Instagram Pinterest Reddit Telegram Twitter Youtube


