


What are Reversal Chart Patterns?
A major a pillar of technical analysis, reversal chart patterns allow you to visually picture an active shift in the supply and demand of an asset. Regardless if you plan to invest in Bitcoin, Ethereum, or any other asset, reversal chart patterns create powerful buy and sell signals that you can utilize to better schedule your investment decisions.
Reversal Chart Patterns Overview
In short, reversal chart patterns indicate that a current price trend is likely to change following the pattern’s completion. For example, if an asset is currently in the middle of a price downtrend, the formation of a reversal trading pattern would signal the likely start of a new upward price trend following the pattern’s completion.
Reversal Chart Patterns That We’ll Cover:
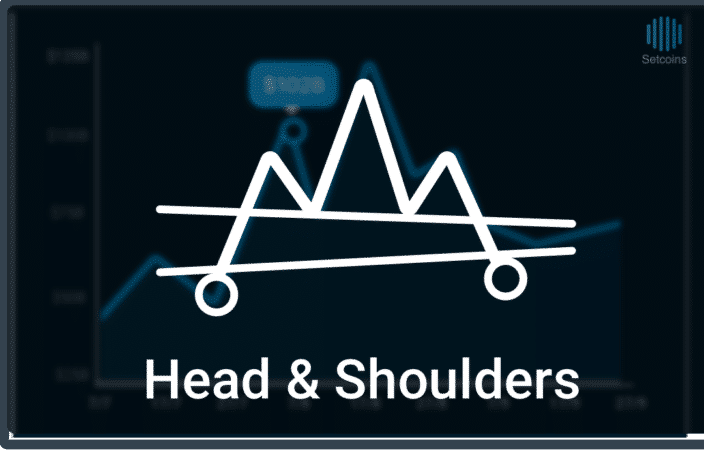
Head and Shoulders
One of the most reliable chart patterns, Head and Shoulders is a bearish formation that predicts the reversal of a current uptrend. As the name implies, the pattern resembles a raised head situated above a lower shoulder on each of its sides.
The pattern’s neckline is drawn across the bottom of the left shoulder to the bottom of the right shoulder. In the Head and Shoulders pattern, the neckline serves as an area of support in which the price must eventually drop below.
Once the price drops below the neckline after the formation of the right shoulder, the pattern is completed. This breakout indicates the price will likely proceed lower.
Head and Shoulders Pattern Information:
- Bullish/Bearish – Bearish
- Pattern’s Preceding Price Trend – Upward
- Confirmation Signal – When price closes below an up-sloping neckline or below the right armpit when the neckline slopes downward
- Pattern Price Target = Breakout Price – (Highest Price In Head – Neckline Measured Vertically from Head)
- Percentage of Time Pattern Hits Price Target – 55%
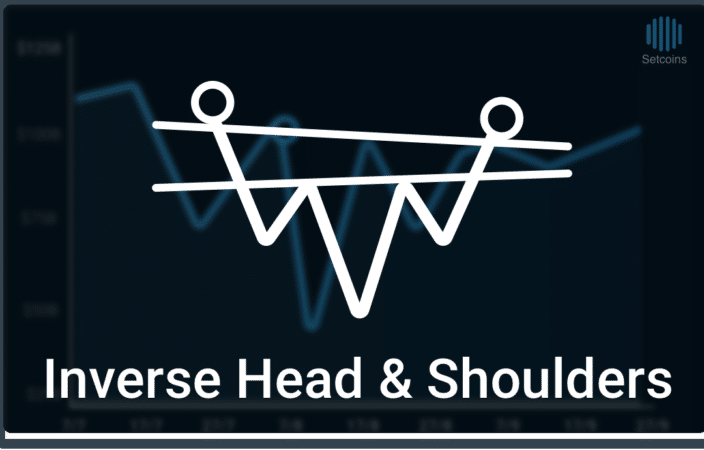
Inverse Head and Shoulders
Sometimes called a Head and Shoulders Bottom, Inverse Head and Shoulders is a bullish formation that predicts the reversal of a current downtrend. As the name implies, the pattern resembles an upside-down head accompanied by a higher shoulder on each of its sides.
The pattern’s neckline is drawn from the top of the left shoulder to the top the right shoulder. In the Inverse Head and Shoulders pattern, the neckline serves an area of resistance in which the price must eventually breakout through.
Once the price rises above the neckline after the formation the right shoulder, the pattern is completed. This breakout indicates the price will likely proceed higher.
Inverse Head and Shoulders Pattern Summary:
- Bullish/Bearish – Bullish
- Pattern’s Preceding Price Trend – Downward
- Confirmation Signal – When price closes above a downward sloping neckline or above the right armpit when the neckline slopes upward
- Pattern Price Target = Breakout Price + (Neckline Measured Vertically from Head – Lowest Price In Head)
- Percentage of Time Pattern Hits Price Target – 74%
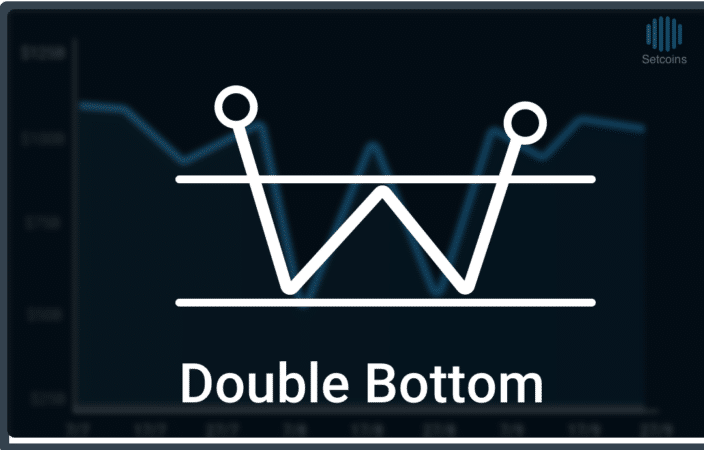
Double Bottom
A frequent formation at the end of a bear market, the Double Bottom is a bullish formation that predicts a reversal of a current downtrend. Resembling the “W” shape, the pattern is formed by two consecutive troughs that have roughly the same lows that are separated by a local peak.
Drawn horizontally at the local peak, the pattern’s neckline acts an area of resistance in which the price must eventually break through. The Double Bottom is completed when the price rises above the neckline, indicating that further price rise is likely.
Double Bottom Pattern Summary:
- Bullish/Bearish – Bullish
- Pattern’s Preceding Price Trend – Downward
- Confirmation Signal – When price closes above the peak between the two valleys
- Pattern Price Target = Highest Peak + (Highest Peak – Lowest Valley)
- Percentage of Time Pattern Hits Price Target – 66%
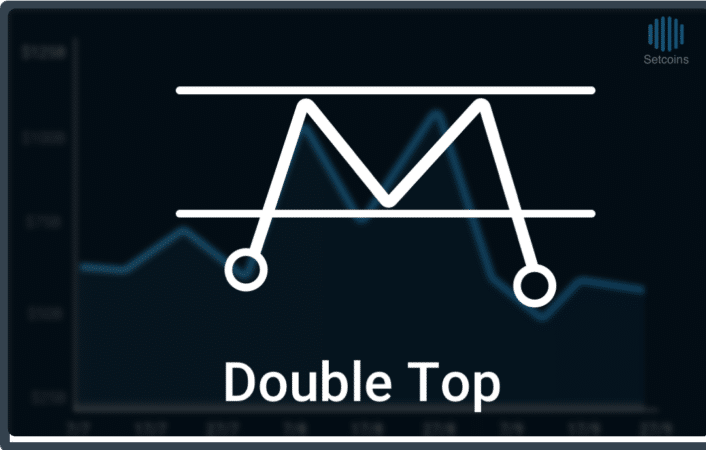
Double Top
A frequent price formation at the end of a bull market, the Double Top is a bearish formation that predicts a reversal of a current uptrend. The pattern is formed by two consecutive peaks with roughly the same highs that are separated by a local low.
Drawn horizontally at the local peak, the pattern’s neckline acts an area of support in which the price must eventually break below. The formation is completed when the price drops below the neckline, indicating that a further price decline is likely.
Double Top Pattern Summary:
- Bullish/Bearish – Bearish
- Pattern’s Preceding Price Trend – Upward
- Confirmation Signal – When price closes below the valley between the two peaks
- Pattern Price Target = Lowest Valley – (Highest Peak – Lowest Valley)
- Percentage of Time Pattern Hits Price Target – 72%
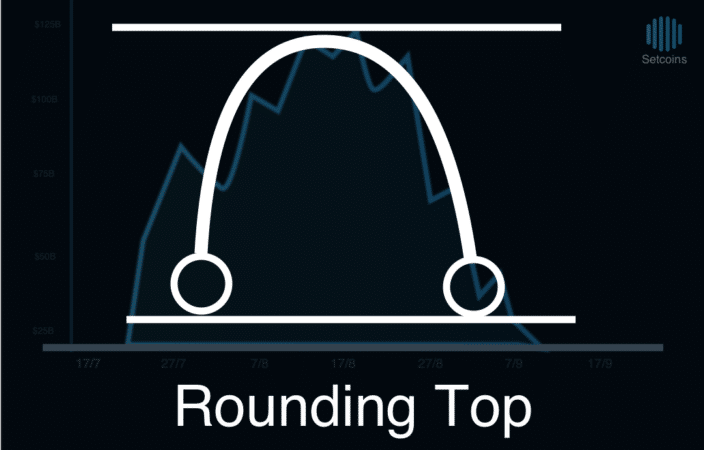
Rounding Top
Sometimes called an Inverse Saucer, the Rounding Top is a bearish formation that predicts the reversal of a current uptrend. Easily identifiable by its upside “U” shape, the Rounding Top pattern is a long-term reversal pattern that normally lasts weeks or months.
Rounding Top Pattern Summary:
- Bullish/Bearish – Bearish
- Pattern’s Preceding Price Trend – Upward
- Confirmation Signal – When price proceeds below right lip of saucer
- Pattern Price Target = Right Saucer Lip – (Highest Peak – Right Saucer Lip)
- Percentage of Time Pattern Hits Price Target – 24%
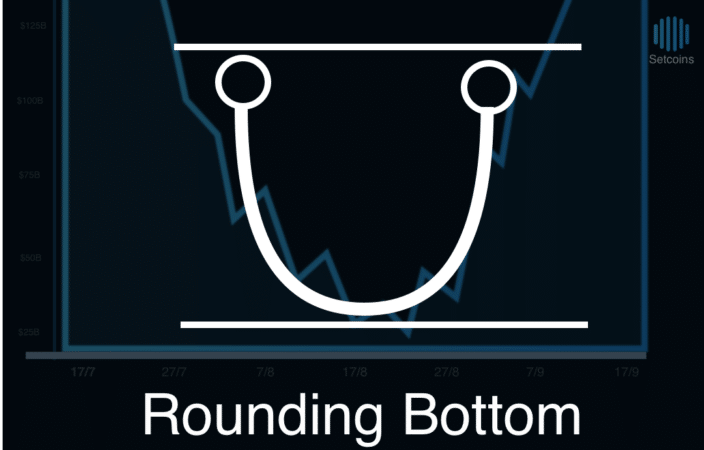
Rounding Bottom
Sometimes called a Saucer Bottom, the Rounding Bottom is a bullish formation that predicts the reversal of a current downtrend. Easily identifiable by its “U” shape, the Rounding Bottom is a long-term reversal pattern that normally lasts weeks or even months.
Rounding Bottom Pattern Summary:
- Bullish/Bearish – Bullish
- Pattern’s Preceding Price Trend – Upward or Downward
- Confirmation Signal – When price closes above the highest peak the pattern
- Pattern Price Target = Right Saucer Lip + (Right Saucer Lip – Lowest Valley)
- Percentage of Time Pattern Hits Price Target – 57%
Conclusion
Reversal chart patterns provide powerful cues about an asset’s future price movement. Helpful in forecasting dramatic shifts in the supply and demand of an asset, reversal chart patterns are an important evaluation tool that can help investors determine when to buy or sell any asset.
The post Introduction to Reversal Chart Patterns appeared first on CoinCentral.

Coincentral.com is author of this content, TheBitcoinNews.com is is not responsible for the content of external sites.
Our Social Networks: Facebook Instagram Pinterest Reddit Telegram Twitter Youtube


