


The outcome distribution for the cryptocurrency complex over recent days has been relatively consistent in terms of bearish action. With the key differentiation comes into play is in terms of relative strength when compared to chart levels in place over the past six weeks.
For example, as we take a close look at Litecoin (LTC) and Cardano (ADA) below, we see two coins that have managed to show some relative weakness but still hold tentatively above their June lows. This can be contrasted with many large coins that have already dove below those lows.
In other words, in a manner of speaking, these two coins may represent an interesting pattern of somewhat stealthy accumulation going on under the surface.
Litecoin (LTC)
Price Analysis
- High: $75.177
- Low: $73.283
- 24-Hour Volume: $259.89M
- 7-day Percent Change: -10.55%
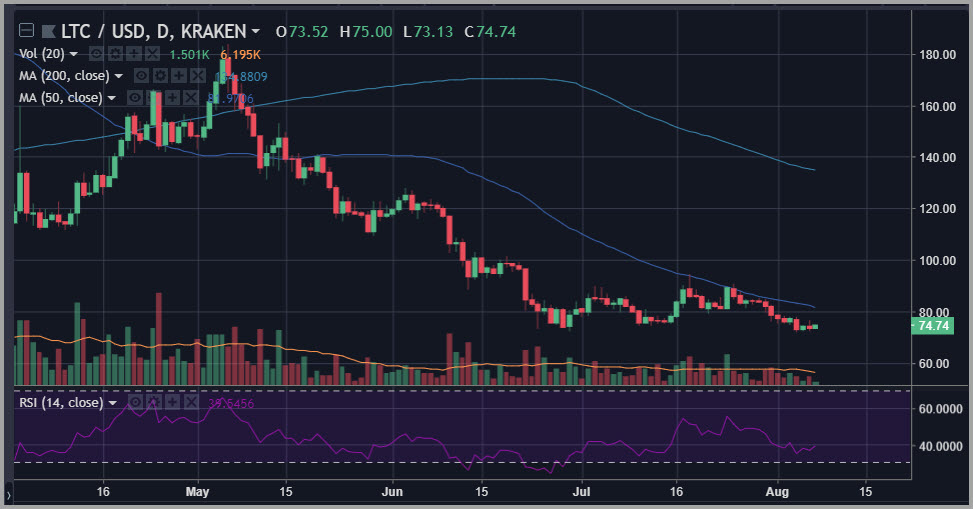
When taking a close look at the Litecoin (LTC) chart, one should immediately be drawn to the massive bullish divergence that can be found when comparing the 14-day RSI print seen in late June with the readings we see in that indicator at present.
This is important because the coin is currently at basically the exact same price right now as it was back when it formed those key late June lows.
When you see a major oscillator like the 14-day RSI print a reading that is nearly 20 points above its comparable reading from the prior pivot low as it tests support, this can often be a kind of stealth bullish signal.
When we also point out that LTC is one of the coins that had been correlated with other coins clearly making new multi-month lows over recent days, we also have justification to keep Litecoin (LTC) on bounce radar until or unless it is able to securely break below the $71 level.
Cardano (ADA)
Price Analysis
- High: $0.13198
- Low: $0.12775
- 24-Hour Volume: $54.31M
- 7-day Percent Change: -14.15%
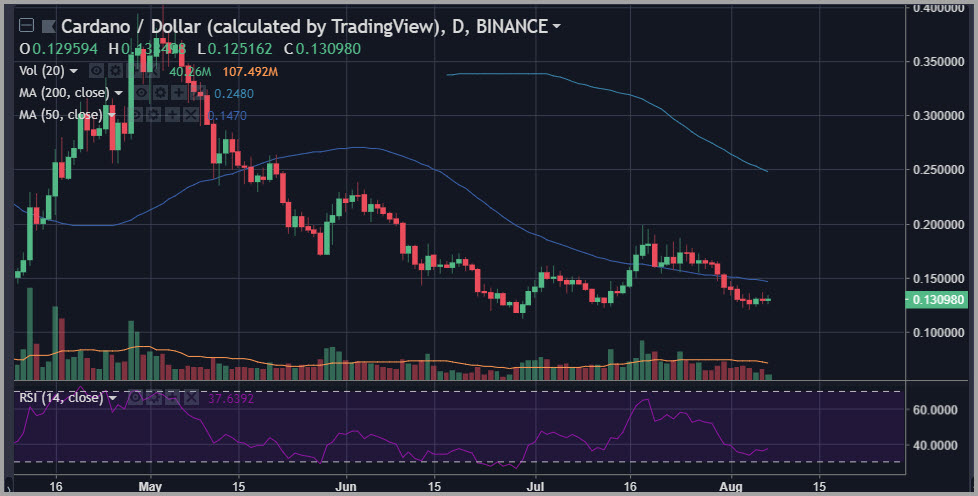
Cardano (ADA), like Litecoin (LTC), has been an interesting combination of relative strength and relative weakness at different points in its recent pattern.
Cardano (ADA) is currently testing key support at the $0.12 level, and it is a level that needs to be held to maintain a pattern that could well represent important levels of accumulation.
Also like Litecoin (LTC), Cardano (ADA) is sporting something that might be considered a bullish divergence on the 14-day RSI pattern. However, over the very recent action, we have seen basically neutral action in terms of the tape, and very little in the way of any kind of signal from the MACD on the hourly chart.
The near-term trend is down – that much is clear and cannot be denied. However, key support levels are in play, and we have some larger time frame signals suggesting that the bearish read here is far from a simple one in ADA.
Happy Trading~
For the latest cryptocurrency news, join our Telegram!
Disclaimer: This article should not be taken as, and is not intended to provide, investment advice. Global Coin Report and/or its affiliates, employees, writers, and subcontractors are cryptocurrency investors and from time to time may or may not have holdings in some of the coins or tokens they cover. Please conduct your own thorough research before investing in any cryptocurrency and read our full disclaimer.
Image courtesy of Pexels
Charts courtesy of tradingview.com
The post Litecoin (LTC) Cardano (ADA) Price Analysis: Interesting Action Under the Surface appeared first on Global Coin Report.
Read more at https://globalcoinreport.com/litecoin-cardano-price-analysis-under-the-surface/

Globalcoinreport.com/ is author of this content, TheBitcoinNews.com is is not responsible for the content of external sites.
Our Social Networks: Facebook Instagram Pinterest Reddit Telegram Twitter Youtube


