


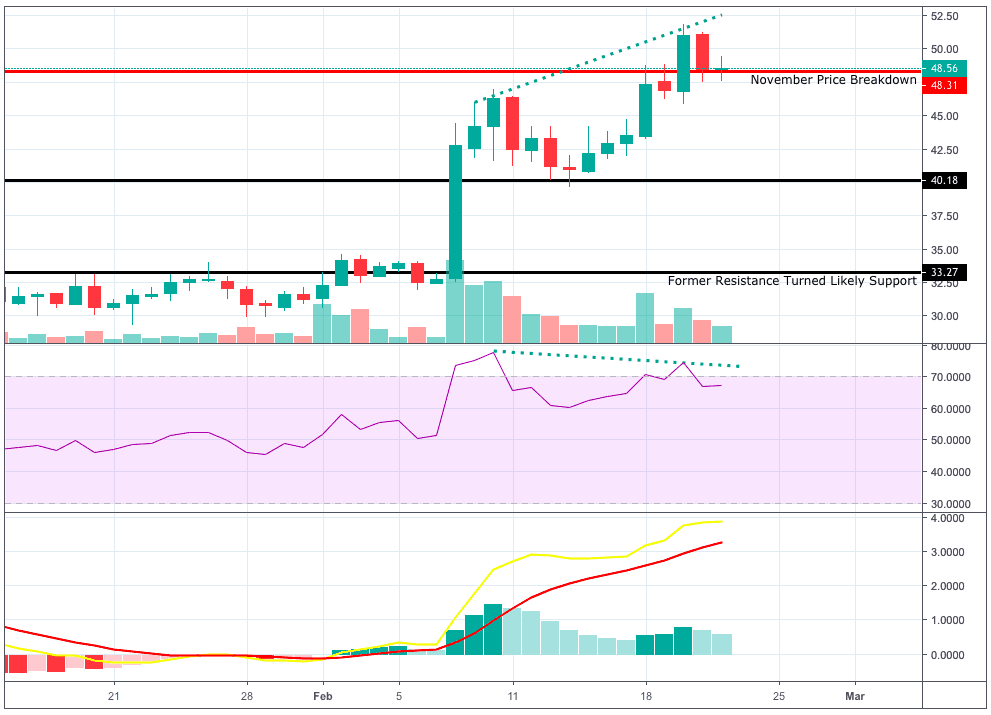
Litecoin Daily Chart – Source: Tradingview.com
Litecoin is after falling back to a key level after a bearish divergence formed on Wednesday between price and RSI.
A bearish divergence is a trend reversal pattern that forms when the price goes on to form higher highs and the RSI forms lower highs.
This shows price continuing to increase despite a fall in buying pressure.
This pattern increases the likelihood of a price drop following, and this was the case in Litecoin with the price dropping back to a key level.
Litecoin returned to $48.31 which is a key level for its price action.
$48.31 was the point where the price broke bearish in mid-November.
After returning to the key level yesterday, today’s price action is forming a Doji candle.
A Doji candle is a candle where the open and the close are around the same point and typically reflects uncertainty from traders.
 Litecoin Hourly Chart – Source: Tradingview.com
Price has traded below the level for a significant amount of time in today’s price action showing the level is not acting as strong support and traders are willing to accept valuations below the level.
The key pattern to monitor for is whether price closes below this level on the daily.
A close below this level on the daily would increase the likelihood of price moving continuing to move lower.
The next key level to monitor is price starts to move to the downside is $40.
 Doge Daily Chart – Source: Tradingview.com
The market increases taking place over the past week have also had resulted in Doge recording increases.
This is not always the case as sometimes Doge can tend to move independently from the rest of the cryptocurrency market.
The price increases have resulted in Doge returning into an important range between $0.002 and $0.0023.
This has been an important range for the price action of Doge in previous price action.
Price traded within this range for a period of three weeks starting in mid-November and a period of two weeks starting in mid-January.
 Doge 6-Hour Chart – Source: Tradingview.com
It took numerous tests for the price to move back within the trading range.
Numerous tests of a level make the level weaker with progressively fewer buyers/sellers to hold the level on each test.
Price has since moved back down to test $0.002 as support and has started recording increases in recent price action.
Key Takeaways:
- Litecoin falls to a key level after bearish divergence forms between the price and RSI.
- Litecoin is forming a Doji reflecting uncertainty from traders.
- The market increases have resulted in Doge moving back within an important trading range.
Latest Litecoin & Dogecoin News:
| DISCLAIMER: Investing or trading in digital assets, such as those featured here, is extremely speculative and carries substantial risk. This analysis should not be considered investment advice, use it for informational purposes only. Historical performance of the assets discussed is not indicative of future performance. Statements, analysis, and information on blokt and associated or linked sites do not necessarily match the opinion of blokt. This analysis should not be interpreted as advice to buy, sell or hold and should not be taken as an endorsement or recommendation of a particular asset. |
RELATED ARTICLES
MORE FROM OUR PARTNERS
Advertisement
blokt.com is author of this content, TheBitcoinNews.com is is not responsible for the content of external sites.
Our Social Networks: Facebook Instagram Pinterest Reddit Telegram Twitter Youtube


