


The goal of a technical analyst during periods of dramatic weakness, as the bear stands up on its hind legs and roars with fury, is to leave emotion out of the game and focus on potential support levels and severely oversold levels in major oscillators. This will be our goal today as we examine the action in NEO and Ethereum (ETH).
Both of these coins have been recently underperforming, but both charts contain some very interesting features that deserve close attention.
NEO
Price Analysis
- High: $25.102
- Low: $22.997
- 24-Hour Volume: $61.72M
- 7-day Percent Change: -17.58%
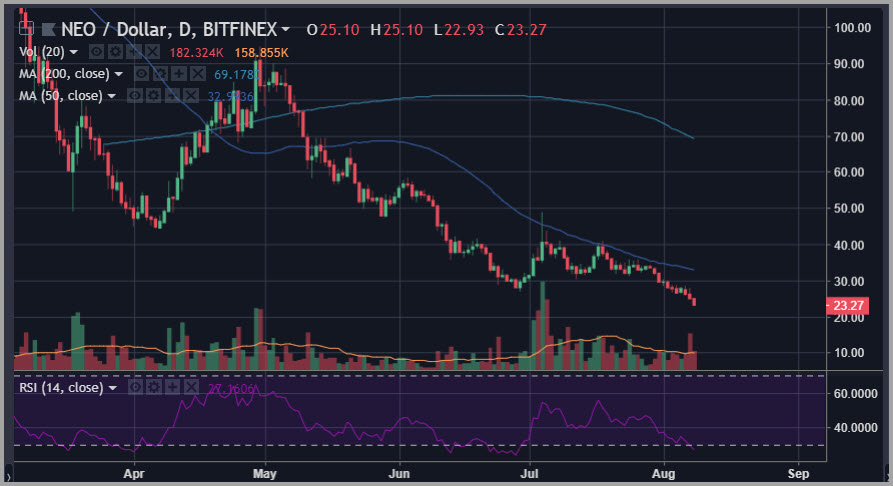
As we have noted in our recent analysis, NEO has been badly underperforming the cryptocurrency complex for the majority of the past six months.
In some ways, it appears as though the bear market for NEO is actually more advanced in terms of its overall technical form, having performed a complete round-trip – or “Christmas tree pattern” – relative to the powerful surge higher we saw in December and January.
At this point, we are already triggering severely oversold levels in the 14-day RSI measure, which is also showing a potential bullish divergence relative to its readings seen during the pivot formed toward the end of June.
One key support level that may come into play for NEO if this action persists is the pivot low formed at the very beginning of November 2017 at around the $22.50 level.
Ethereum (ETH)
Price Analysis
- High: $380.15
- Low: $365.74
- 24-Hour Volume: $1.90B
- 7-day Percent Change: -10.87%
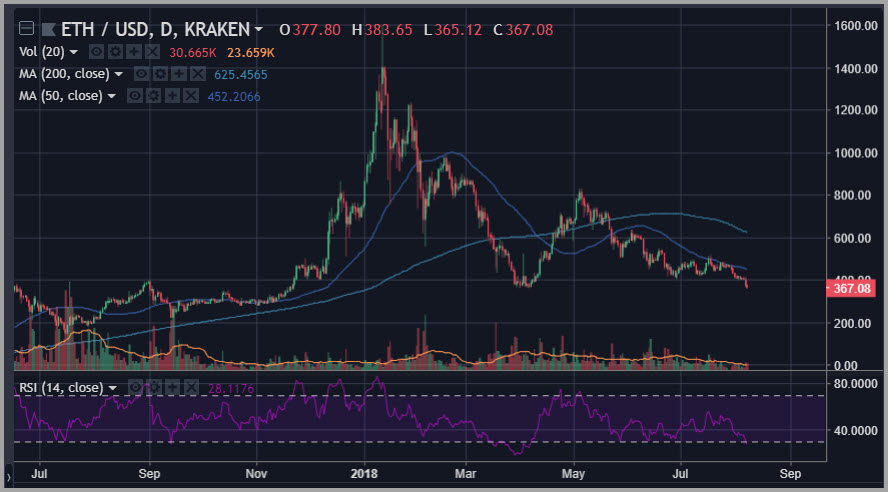
Ethereum (ETH) is in some ways very different from NEO but in other ways very similar.
Ethereum (ETH) has already badly broken below its late June lows, as well as key support at the $400 level. However, it remains well above the pivot formed in early April down near the $350 level. This is the clear target that we see in play during current action, as it also lines up confluence with the minor pivot high scored on the charts in the middle of October 2017.
This is an extraordinarily important level for Ethereum (ETH), and a break below it could put into play the range lows formed around the $275 area during early November of last year.
However, with a bearish trend in place, and assuming no new fundamental catalysts, one has to assume that any bounce – if we are in a persisting downward trend at the moment – should encounter very difficult resistance in the zone defined roughly as a tight range from $395 and $405.
Happy Trading~
For the latest cryptocurrency news, join our Telegram!
Disclaimer: This article should not be taken as, and is not intended to provide, investment advice. Global Coin Report and/or its affiliates, employees, writers, and subcontractors are cryptocurrency investors and from time to time may or may not have holdings in some of the coins or tokens they cover. Please conduct your own thorough research before investing in any cryptocurrency and read our full disclaimer.
Image courtesy of Pexels
Charts courtesy of tradingview.com
The post NEO Ethereum (ETH) Price Analysis: Keep Calm and Analyze appeared first on Global Coin Report.
Read more at https://globalcoinreport.com/neo-ethereum-eth-price-analysis-keep-calm-and-analyze/

Globalcoinreport.com/ is author of this content, TheBitcoinNews.com is is not responsible for the content of external sites.
Our Social Networks: Facebook Instagram Pinterest Reddit Telegram Twitter Youtube


