


While Bitcoin itself hasn’t come even close to making new bear market lows over the course of the past week of action, a number of large market cap coins have this dubious honor. In other words, when looking at the cryptocurrency complex as a set of pieces, breadth has been a clear bearish factor in recent action.
The two coins we are going to look at below – NEO and Ethereum (ETH) – are examples of relative weakness in the context of this trend.
However, the technical signals we see in each case offer some potential for opportunity coming into place on these charts right now. As sentiment sours, opportunity often sweetens.
NEO
Price Analysis
- High: $27.215
- Low: $25.874
- 24-Hour Volume: $53.88M
- 7-day Percent Change: -18.67%
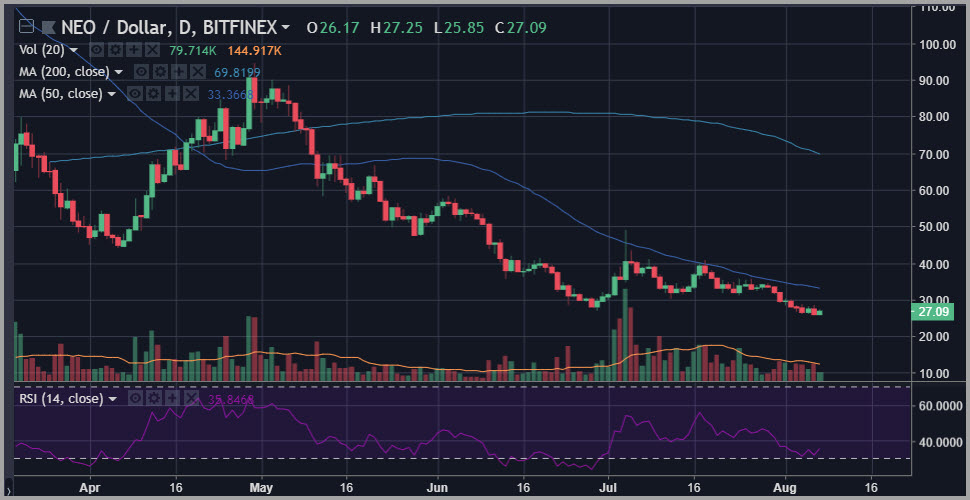
NEO is an extremely interesting technical case study at present. The coin is locked in what appears to be a continuing bear market based on every standard measure of technical interpretation.
However, NEO is also right now coming into a critical zone of very important support defined by what we might call the launching pad that came into place during October 2017 right at the $25 level.
One can make a strong case that NEO is currently oversold, with both the 14-day RSI and hourly MACD indicators flashing evidence to that effect right as we come into this massively important support zone.
On a bounce, the $30 level will clearly be one to watch.
Ethereum (ETH)
Price Analysis
- High: $410.57
- Low: $403.42
- 24-Hour Volume: $1.34B
- 7-day Percent Change: -10.59%
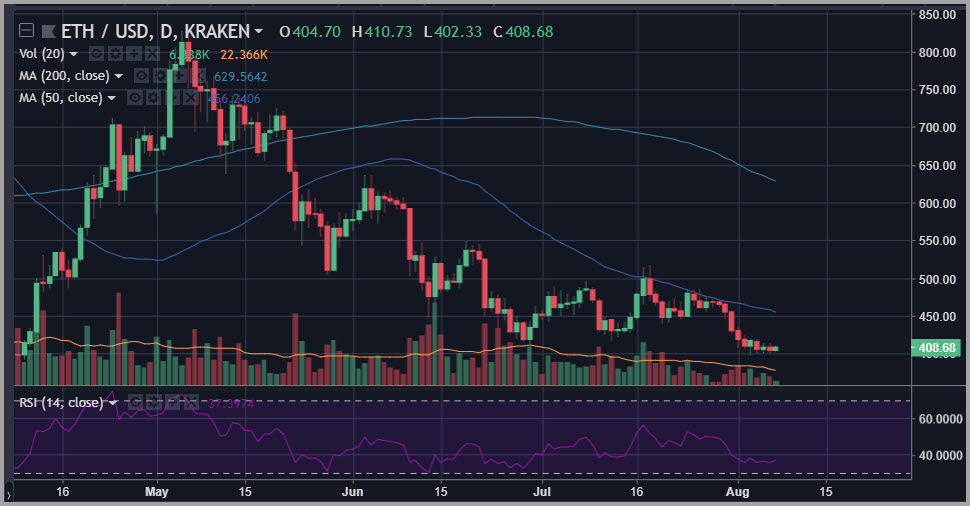
Ethereum (ETH) has been making lower lows relative to the pattern put into place earlier this summer. The breakdown that began this latest leg lower was a breach of a one-month-long upward trend line that characterized the action in July – along with many other large market cap coins.
However, when this trendline was broken early last week, we also saw the coin moving off of resistance at its 50-day simple moving average.
This was a difficult one-two punch that bulls in Ethereum (ETH) just couldn’t shake off.
At this point, key support is in place at the $400 level. That level is now defining the action for this chart. However, the MACD indicator for Ethereum (ETH) is flashing a positive signal at present, and interior resistance lies just above at the $425 level.
Happy Trading~
For the latest cryptocurrency news, join our Telegram!
Disclaimer: This article should not be taken as, and is not intended to provide, investment advice. Global Coin Report and/or its affiliates, employees, writers, and subcontractors are cryptocurrency investors and from time to time may or may not have holdings in some of the coins or tokens they cover. Please conduct your own thorough research before investing in any cryptocurrency and read our full disclaimer.
Image courtesy of Pexels
Charts courtesy of tradingview.com
The post NEO Ethereum (ETH) Price Analysis: Reading the Tea Leaves appeared first on Global Coin Report.
Read more at https://globalcoinreport.com/neo-ethereum-eth-price-analysis-reading-the-tea-leaves/

Globalcoinreport.com/ is author of this content, TheBitcoinNews.com is is not responsible for the content of external sites.
Our Social Networks: Facebook Instagram Pinterest Reddit Telegram Twitter Youtube


