


Bitcoin price corrected lower recently, but stayed above the $3,880 support area. BTC is currently forming a crucial breakout pattern and it is likely to climb higher.
In the short term, there could be bearish moves, but BTC and altcoins like Ethereum (ETH), ripple (XRP), bitcoin cash (BCH), litecoin (LTC), binance coin (BNB), stellar (XLM) and EOS are likely to extend gains in the coming days.
Key Takeaways:
- Bitcoin price is trading nicely above the $3,880 and $3,900 support levels.
- Ethereum price must break the $140 and $144 resistance level to gain further.
- Ripple price is trading inside a crucial breakout pattern with resistance near the $0.3300 level.
- EOS seems to be forming a solid support near the $3.45-3.50 zone.
- ORME gained more than 800% and CRO rallied close to 250% during the past 7 days.
Bitcoin Price Analysis
After trading above the $4,000 level, bitcoin price faced a strong resistance near the $4,040 level. Later, BTC/USD started a downside correction and traded below the $4,000 and $3,950 support levels.
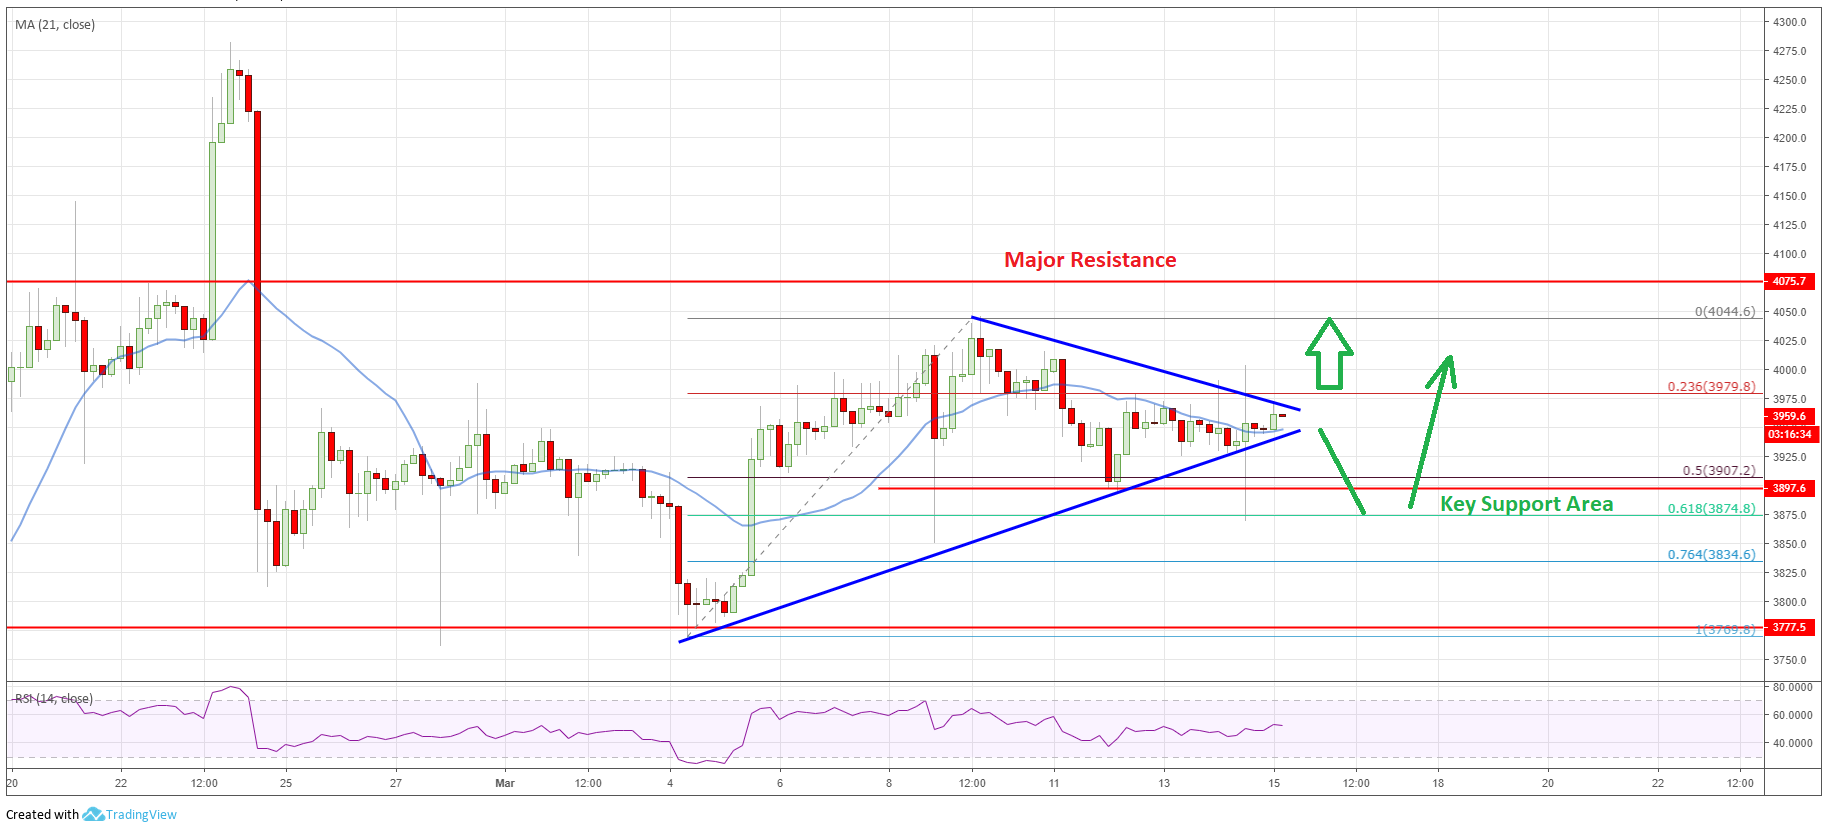
Bitcoin Price Chart: Click to Enlarge
Looking at the 4-hours chart, the price topped near the $4,044 level before starting a downside correction. It traded below the $3,950 support and the 21 simple moving average (4-hours). Besides, there was a break below the 23.6% Fib retracement level of the last wave from the $3,769 low to $4,044 high.
However, the decline was protected by the key $3,880-3,900 support area. More importantly, the 50% Fib retracement level of the last wave from the $3,769 low to $4,044 high also acted as a support.
The price rebounded above $3,925 and later starting consolidating in a tight range. At the outset, there is a crucial breakout pattern forming with resistance at $3,980 on the same chart. Should bitcoin break the $3,980 and $4,000 resistance levels, there could be an upside extension above the $4,040 level.
The next key resistance is at $4,075, above which the price may continue to rise towards the $4,150 and $4,200 levels. On the other hand, if there is a downside break below $3,940 and the 21 simple moving average (4-hours), there could be more losses.
However, the $3,900 support might continue to act as a strong support. If sellers clear the $3,900 support level, the price may could move into a bearish zone. The next main support is at $3,840, followed by $3,770.
Ethereum Price Analysis
Ethereum price started a fresh decline after it failed to move above the $144-145 resistance area. ETH/USD declined below the $140 and $138 support levels to move into a short term bearish zone.
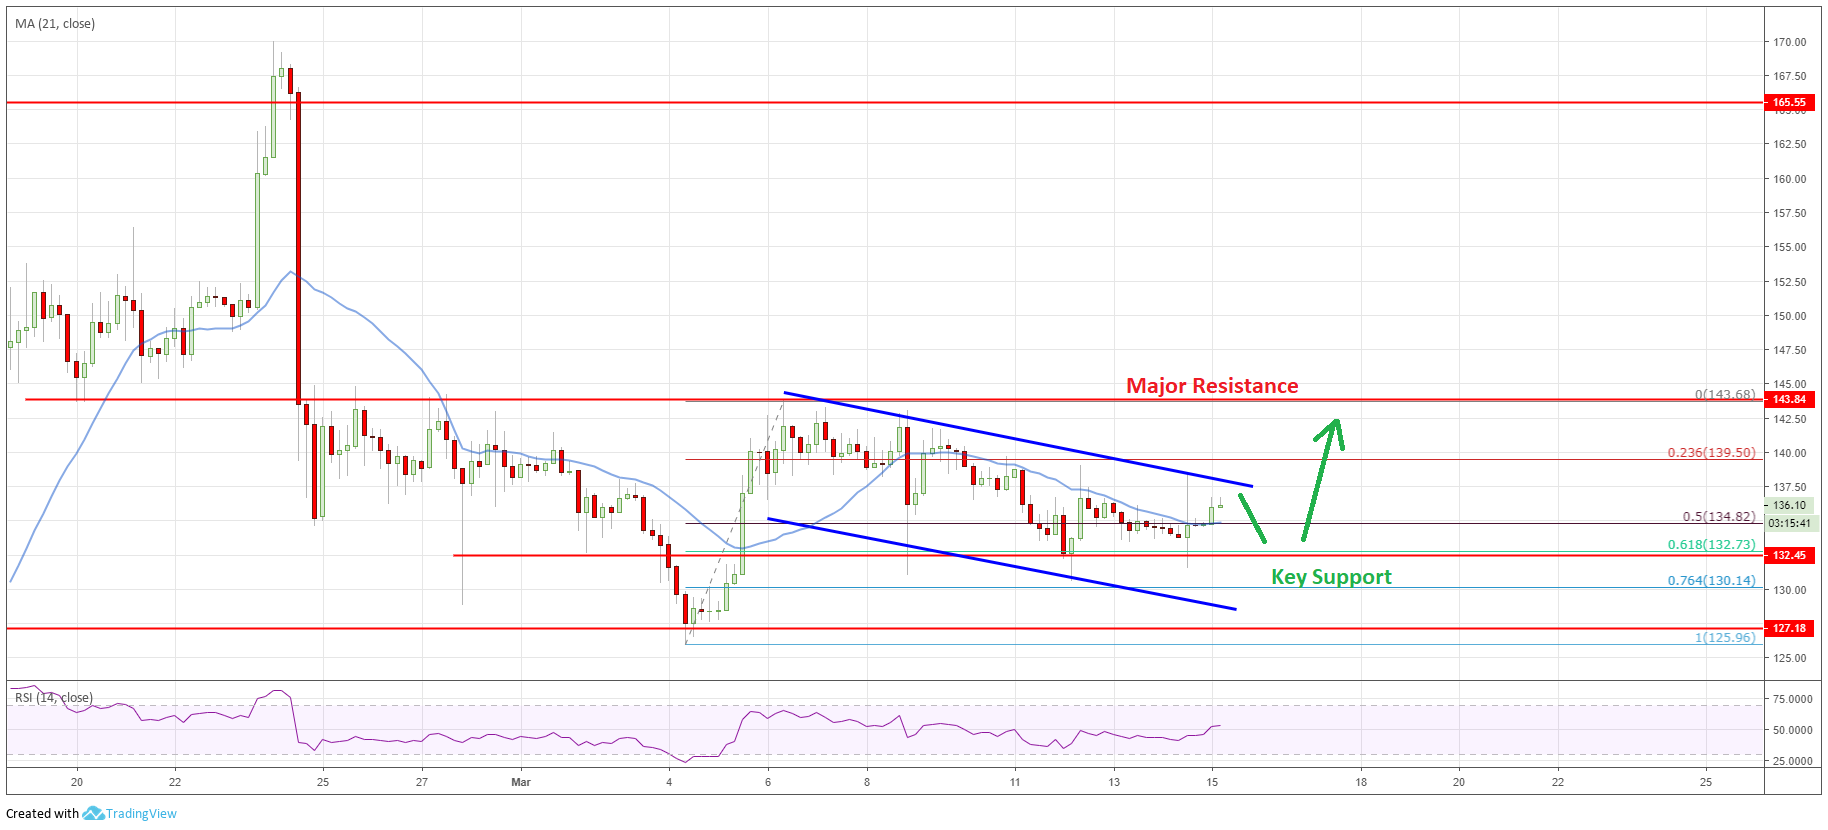
Ethereum Price Chart: Click to Enlarge
Looking at the 4-hours chart, the price even declined below the $135 support and the 21 simple moving average (4-hours). During the drop, sellers pushed the price below the 50% Fib retracement level of the last wave from the $126 swing low to $144 swing high.
However, the $130-132 area acted as a strong support and prevented more losses. Besides, the 61.8% Fib retracement level of the last wave from the $126 swing low to $144 swing high also acted as a support.
The price recovered above $134 and the 21 simple moving average (4-hours). To the upside, there is a strong resistance formed near the $138 zone. There is also a declining channel in place with resistance at $138 on the same chart.
A successful close above the channel resistance could open the doors for more gains above the $140 level. The main resistance area is at $144-145, above which ETH may gain bullish momentum.
On the downside, an initial support is near the $134 level and the 21 simple moving average (4-hours). The current price action suggests that there could be a minor dip towards the $130 support area before the price could climb above $138 and $140.
Ripple Price Analysis
Ripple price remained in a broad contracting range above the $0.3000 support against the US Dollar as discussed in the last analysis. XRP/USD made a couple of swing moves, but it failed to gain momentum above the key $0.3300 resistance area.
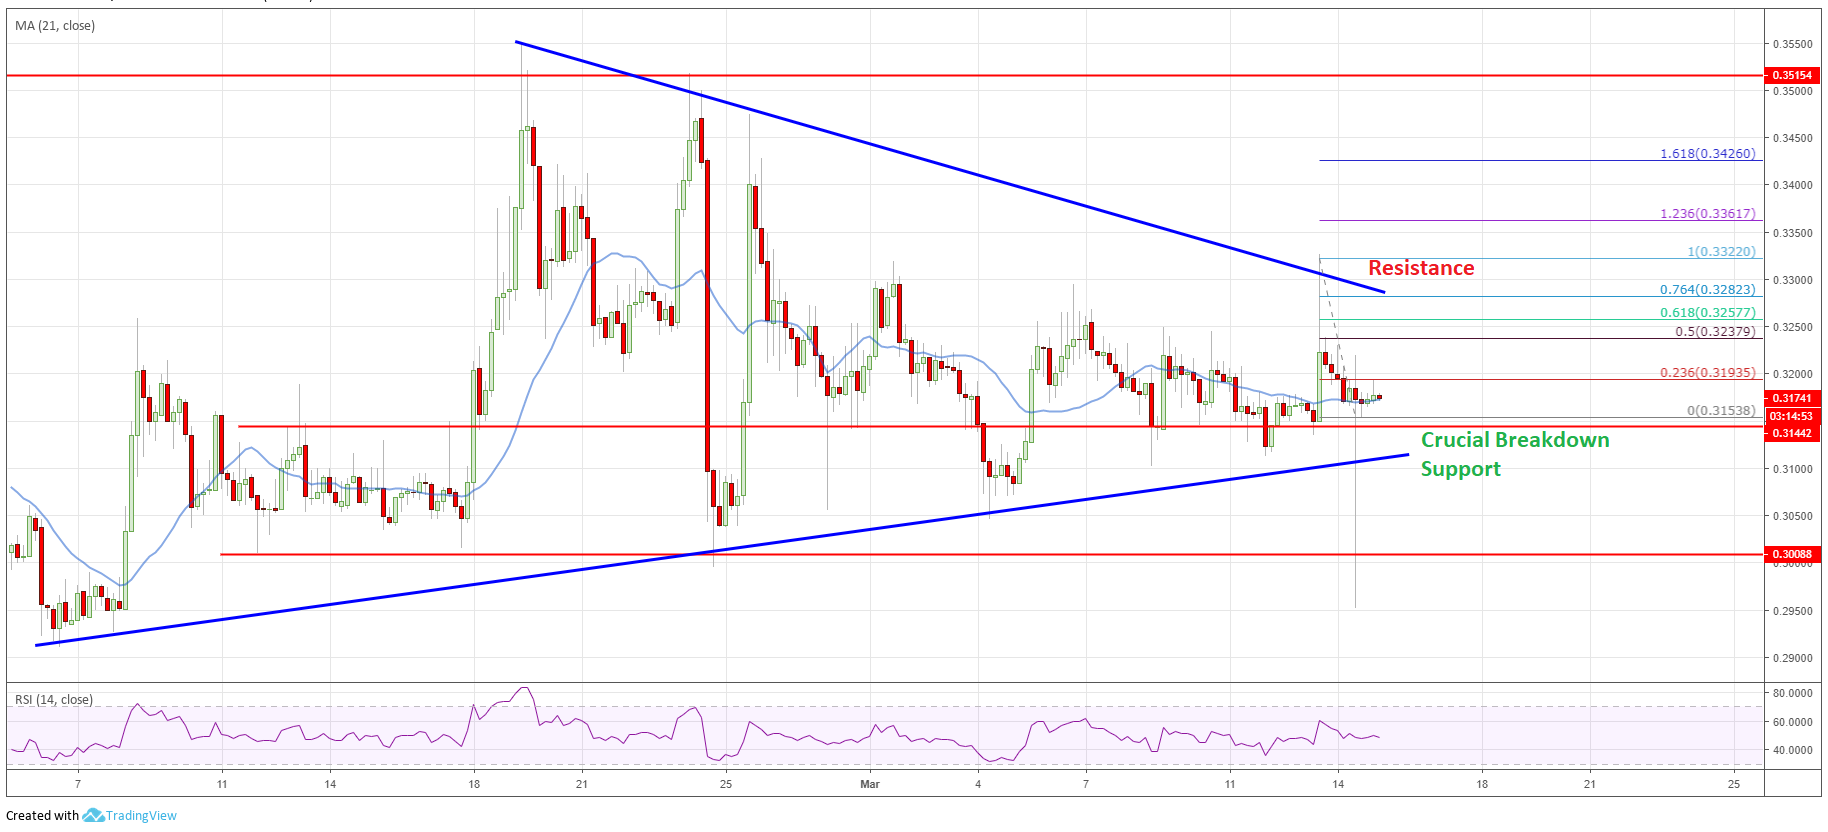
Ripple Price Chart: Click to Enlarge
Looking at the 4-hours chart, the price seems to be forming a solid support above the $0.3100 and $0.3140 levels. Recently, there was a spike above the $0.3200 resistance area. The price even climbed above the $0.3300 level, but it failed to hold gains.
It declined sharply below $0.3300 and the $0.3200 level. It traded as low as $0.3153 and recently recovered above $0.3160 and the 21 simple moving average (4-hours).
On the upside, an initial resistance is near $0.3240 and the 50% Fib retracement level of the recent decline from the $0.3322 high to $0.3153 low. More importantly, there is a crucial breakout pattern in place with resistance near the $0.3300 level.
Therefore, the price must settle above $0.3300 to move into a positive zone and start a solid uptrend. On the other hand, if there is a downside break below the $0.3100 and $0.3000 supports, there could be a strong decline towards $0.2800.
EOS Price Analysis
After a strong upward move above the $3.50 level, EOS price faced sellers near $4.00 against the US Dollar. The price traded as high as $4.00 and later started a downside correction.
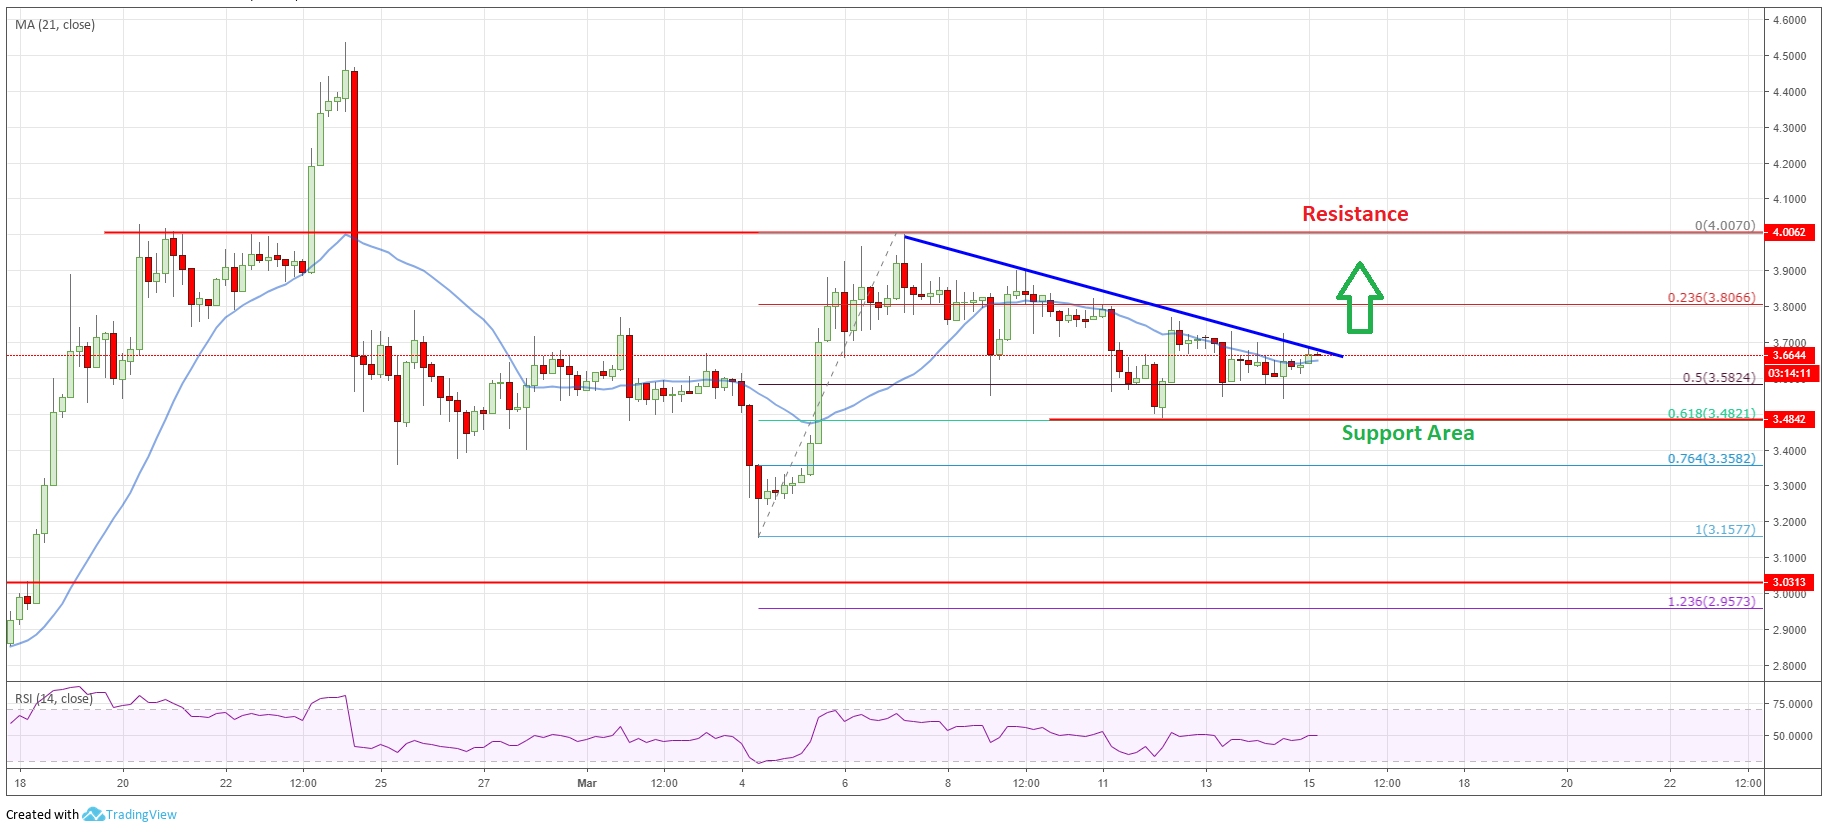
EOS Price Chart: Click to Enlarge
Looking at the 4-hours chart, the price declined below the $3.80 support and the 21 simple moving average (4-hours). There was even a break below the $3.60 support and the 50% Fib retracement level of the last wave from the $3.15 low to $4.00 high.
However, the $3.45-3.50 support zone acted as a strong buy zone. Besides, the 61.8% Fib retracement level of the last wave from the $3.15 low to $4.00 high acted as a support.
The price recovered recently above the $3.55 level, but upsides remain capped. There is a major bearish trend line formed with resistance near the $3.70 level. Should EOS break the trend line, the price may climb above the $3.75 and $3.80 resistance levels.
The main resistance is at $4.00, above which it could test the $4.30 level. On the downside, an initial support is near the $3.50 level, below which there is a risk of more losses below the $3.45 and $3.30 levels in the near term.
Top Gainers
During the past 7 days, a few small cap altcoins gained bullish momentum and posted more than 100% gains, including ORME, CRO, CPC, NOAH, SIX, TCN and IIC (trading volume more than $50K). Out of these, ORME rallied around 800% and CRO gained nearly 250%.
To sum up, bitcoin price seems to be preparing the next crucial move either above $4,000 or below $3,900. In the short term, BTC could decline, but the technical structure suggests that dips remain supported. Therefore, there are high chances of more upsides in Bitcoin and altcoins such as Ethereum, ripple, bitcoin cash, stellar, TRX, EOS, ADA, LTC, BNB and XMR could slide in the coming sessions.
The market data is provided by TradingView, Bitfinex.
The post Price Watch: Bitcoin, Ethereum, Ripple & EOS Price Analysis 15th March appeared first on Blockonomi.

Blockonomi.com is author of this content, TheBitcoinNews.com is is not responsible for the content of external sites.
Our Social Networks: Facebook Instagram Pinterest Reddit Telegram Twitter Youtube


