


Cryptocurrency traders have an interesting problem in recent action: at long last, needing to make the adjustment from bearish assumptions to bullish assumptions as far as near-term technical action is concerned.
This can actually be a bigger problem than it sounds. Our minds get trained to extrapolate our recent experiences. This is called a “recency bias”. And it can be a major hurdle for those seeking to profit from tried and true technical setups such as the ones we will look at below.
Today, we’re going to take a look at the recent action and longer-term patterns for Ripple (XRP) and Bitcoin Cash (BCH) with an eye on determining near-term potential.
Ripple (XRP)
Price Analysis:
- High: $0.46364
- Low: $0.45829
- Major Resistance Level: $0.50
- Hourly MACD: Emerging Upside Momentum Potential
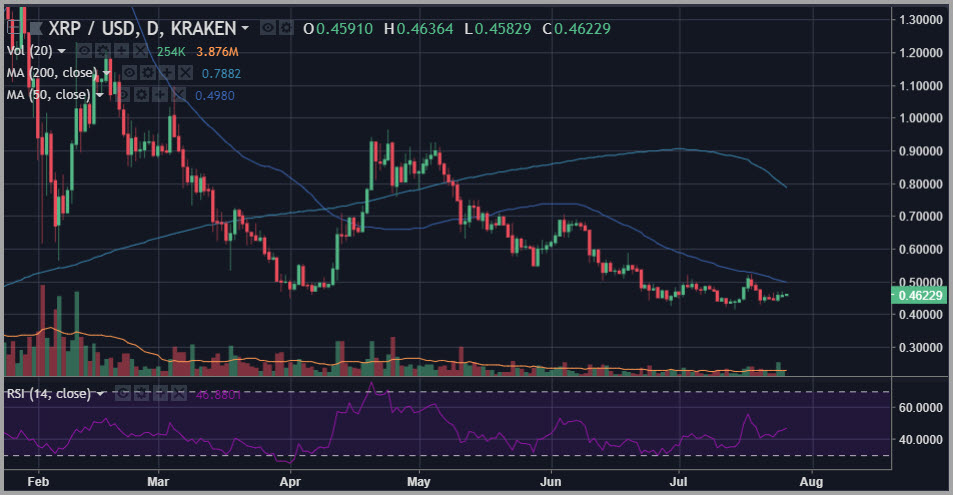
As we take a look at the chart for Ripple (XRP), the most salient factor is unquestionably the broad supportive pattern along the $0.45 level.
The other key factor to note here is the upside potential if we are to see this coin break through the $0.50 level from here.
Support has been well-established between $0.42 and $0.45. We have a variety of different indicators supporting that hypothesis, including oscillator divergences and candlestick patterns – just take a look at the chart above and note all of the long-tailed doji’s sticking to the downside at support in both April and over the past month.
At this point, Ripple (XRP) is in a face-off with the $0.50 level, where it has strong pattern resistance as well as a declining 50 day simple moving average at chart confluence.
If we see a punch above this level, it may well be off to the races for Ripple (XRP).
Bitcoin Cash (BCH)
Price Analysis:
- High: $842.10
- Low: $831.10
- Major Resistance Level: $875
- Hourly MACD: Emerging Upside Momentum

Bitcoin Cash (BCH) is clearly tagged along with recent strength in Bitcoin – its older brother. The most notable recent development for Bitcoin Cash (BCH) is the punch above the key 50-day simple moving average in confluence with the all-important $800 level.
The move above this level and above the moving average constitutes a potential pattern break that pushes this chart into a new bullish context.
It will be critical to see Bitcoin Cash (BCH) maintain this new tone and not slide back under the $775 level, where sloped support could bring about a flush of newly minted long side traders.
If this is a trading range in play in 2018, then the potential here is extraordinary, with the next level resistance miles above at the $1200 level.
Happy Trading~
For the latest cryptocurrency news, join our Telegram!
Disclaimer: This article should not be taken as, and is not intended to provide, investment advice. Global Coin Report and/or its affiliates, employees, writers, and subcontractors are cryptocurrency investors and from time to time may or may not have holdings in some of the coins or tokens they cover. Please conduct your own thorough research before investing in any cryptocurrency and read our full disclaimer.
Image courtesy of Pexels
Charts courtesy of tradingview.com
The post Ripple (XRP) Bitcoin Cash (BCH) Price Analysis – An Unfamiliar Problem appeared first on Global Coin Report.
Read more at https://globalcoinreport.com/ripple-xrp-bitcoin-cash-bch-price-analysis-an-unfamiliar-problem/

Globalcoinreport.com/ is author of this content, TheBitcoinNews.com is is not responsible for the content of external sites.
Our Social Networks: Facebook Instagram Pinterest Reddit Telegram Twitter Youtube


