


Today, we’re going to take a close look at two charts that bear some clear resemblance within the spectrum of large market Coins in the crypto complex right now.
Both Ripple (XRP) and Stellar (XLM) are in wide-swinging trading ranges, or consolidative patterns, in the wake of the energetic mania style bull market that we saw to close out 2017. And both of them may be said to be in relatively bearish postures at present, however, with the potential to inflect and thereby exemplify and highlight what could be interpreted as powerful accumulation bids by strong hands setting the terms of support at key levels.
The most important feature that would mark such a shift would first be signaled by an exhaustion of the selling force that has defined this bearish trend for most of this year to date.
Ripple (XRP)
Price Analysis:
- High: $0.45184
- Low: $0.44020
- Major Resistance Level: $0.47
- Hourly MACD: Steady Downside Momentum
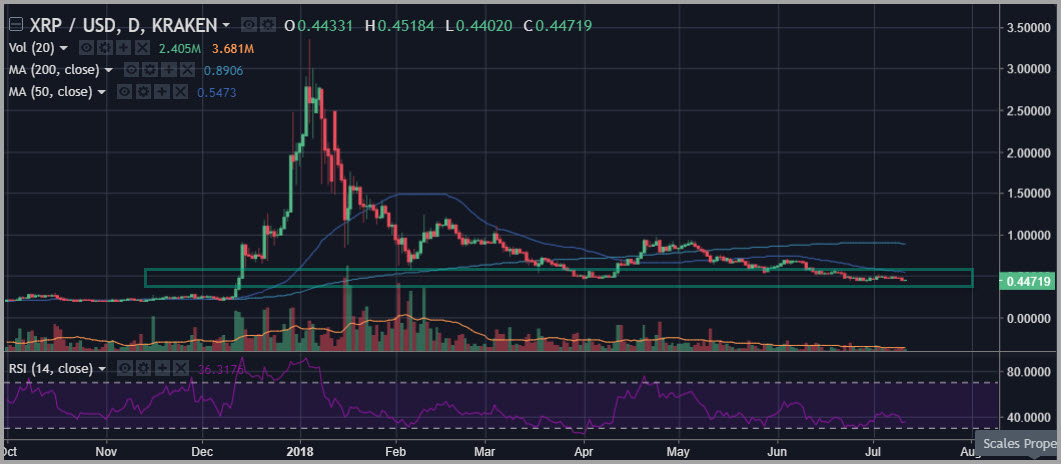
Ripple (XRP) has established clear and important support around the $0.45 level. This level was established as a level of interest earlier this year when the coin made its lows toward the end of March and the beginning of April. We have now begun to test that level and slightly break underneath it, as we formulate the action for June and July.
This is a critical stage for XRP. As the pattern evolves, one no doubt can see the potential for something similar to a descending triangle pattern underway at a relatively significant time frame.
Under most circumstances, such a pattern has bearish implications. However, it can also be an exceedingly bullish pattern if the attempt to follow through on the downside is denied, thereby highlighting the importance of the level for deep-pocketed bulls who have begun to move in and accumulate this coin.
While we don’t yet see the signals that would differentiate these outcomes in the case of XRP, we do know that recent lows have been exemplified by oversold readings on a number of different important technical oscillators, suggesting that downside momentum has at the very least stalled out.
Selling pressure may well resume, but the region on the XRP chart defining the recent lows toward the end of June should be marked out with a close eye as it can define a reasonable risk point for speculative entries in Ripple (XRP) right now.
Stellar (XLM)
Price Analysis:
- High: $0.196650
- Low: $0.183387
- Major Resistance Level: $0.215
- Hourly MACD: Oversold on Sharp Momentum
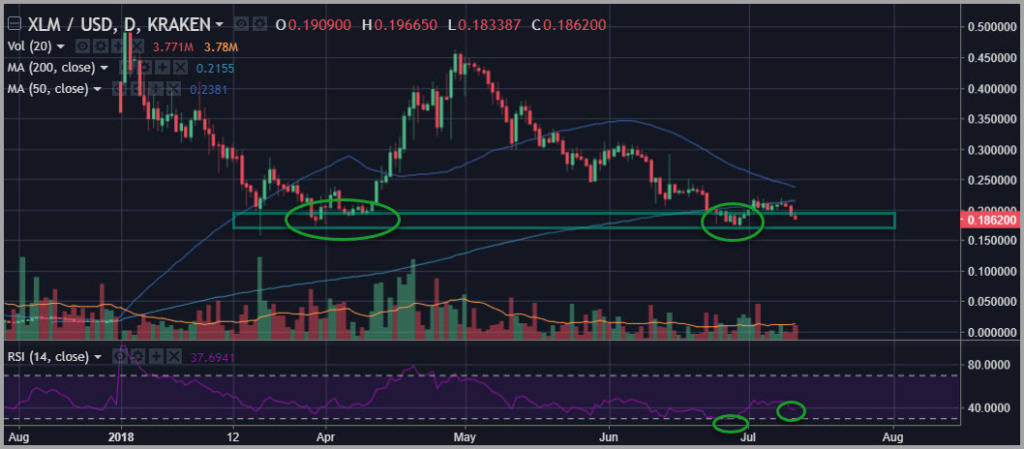
When we look closely at the Stellar (XLM) chart, we see something quite similar to the picture we find in many different coin charts at present: an important low toward the end of the first fiscal quarter that is being retested in recent action.
This process can be viewed a couple of different ways. From one point of view, it’s precisely what you may expect as part of the procession of a bear market. Levels get established, and then they get broken.
But that’s exactly where this type of chart becomes very interesting.
It is, in fact, an important technical testing ground. One assumes that the level being tested represents a spot on the chart – a price level – where we previously saw a large supportive bid enter the complex has a whole, and in Stellar (XLM), in particular.
And that’s where the testing process bears itself out as such an important feature in the construction of a technical chart pattern: if we see XLM attempt to break below that level and effectively fail at that breakdown, then we may, in fact, be seeing an important low come into place that offers a sound entry point for aspiring bulls to get involved with defined risk.
Happy Trading!!
For the latest cryptocurrency news, join our Telegram!
Disclaimer: This article should not be taken as, and is not intended to provide, investment advice. Global Coin Report and/or its affiliates, employees, writers, and subcontractors are cryptocurrency investors and from time to time may or may not have holdings in some of the coins or tokens they cover. Please conduct your own thorough research before investing in any cryptocurrency and read our full disclaimer.
Image courtesy of Pexels
Charts courtesy of tradingview.com
The post Ripple (XRP) Stellar (XLM) Price Analysis – Exhaustion Awaits appeared first on Global Coin Report.

Globalcoinreport.com/ is author of this content, TheBitcoinNews.com is is not responsible for the content of external sites.
Our Social Networks: Facebook Instagram Pinterest Reddit Telegram Twitter Youtube


