


Long-Term Outlook
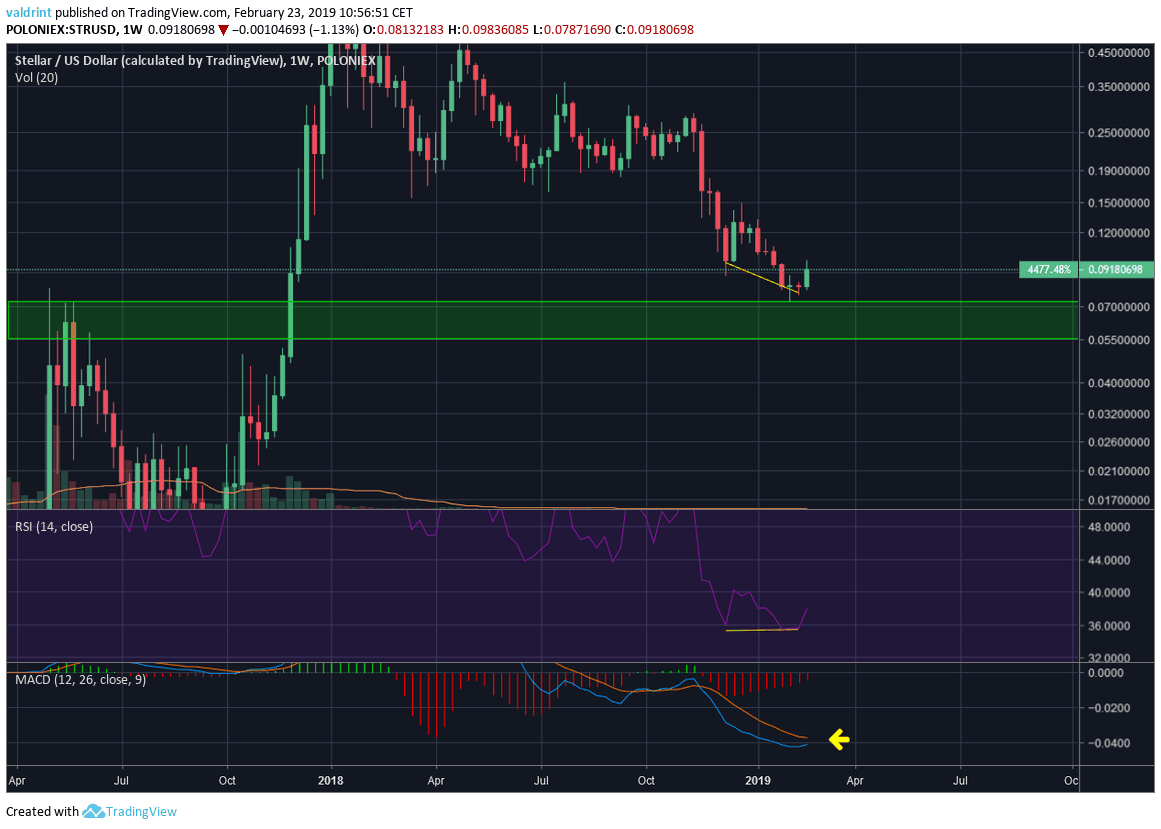
Stellar (XLM) Weekly Logarithmic Chart
A look at the Weekly chart for XLM / USD in logarithmic form shows that price is trading above the support area of $0.06/$0.07 created by the highs of April 2018.
Price has created a small amount of bullish divergence with the RSI.
Furthermore, the MACD is very close to making a bearish cross for the first time since September 2018.
After two doji weekly candles (indecision), we are in the process of forming a bullish candle, depending on how the week closes.
Given this information, I am leaning towards a bullish market for the long-term scenario.
Medium-Term Outlook
 Stellar (XLM) 3-Day Chart
A look at the 3-day chart follows the findings from the weekly one.
There is a more pronounced bullish divergence in both the RSI and the MACD.
Furthermore, the latter has already made a bullish cross, rejected a bearish one and is now moving upward towards positive territory.
However, on a bearish note, the price is below all moving averages and the Ichimoku cloud, facing particularly close resistance from the 21-period MA.
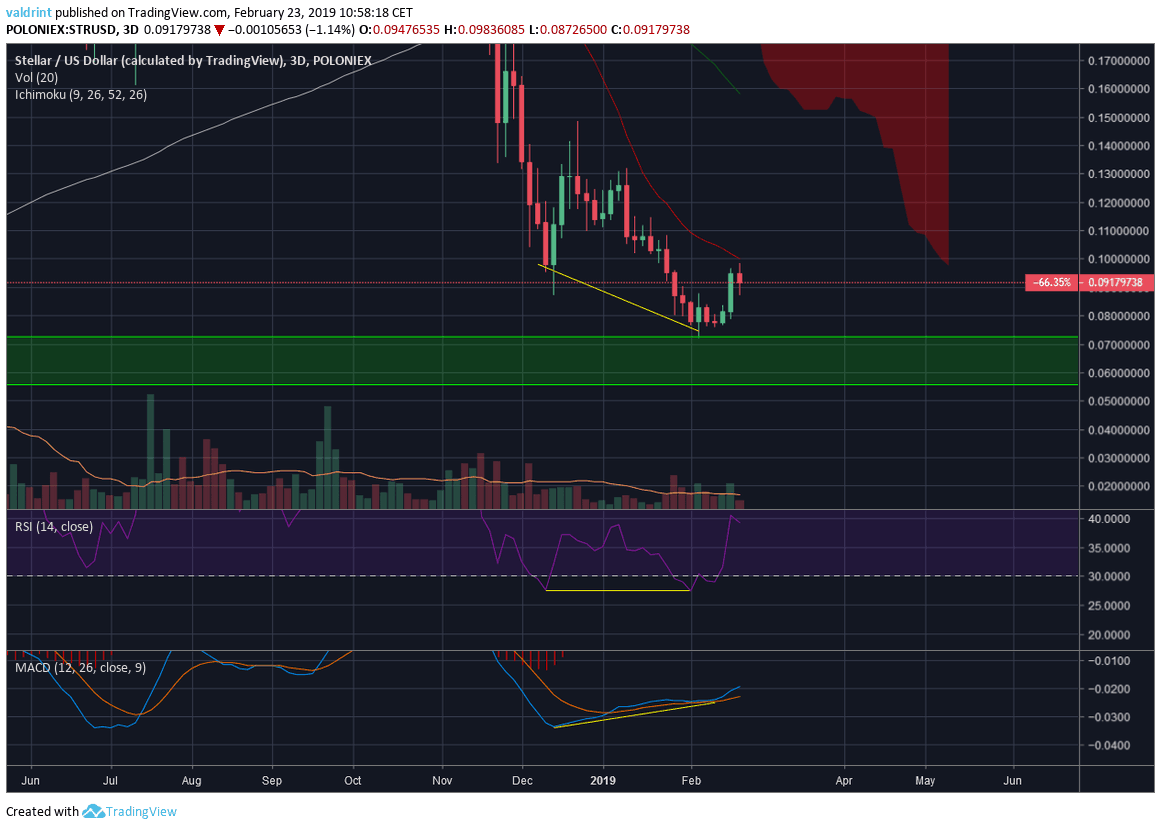
 Stellar (XLM) Daily Chart
The Daily chart gives us the first resistance area ($0.09-0.095) formed by previous lows and the 50-period MA/Ichimoku cloud.
We can see that after reaching the 50-period MA, the price made a bearish engulfing candle and has not yet moved above the high of $0.098.
It is worth mentioning that the highest volume was seen on February 19, on a bullish candle.
Finally, the 21-period MA is moving upward, possibly setting itself up for a bullish cross.
Given this information, I am bullish on the medium-term, especially if we are able to break above $0.1.
Short-Term Outlook and Price Prediction
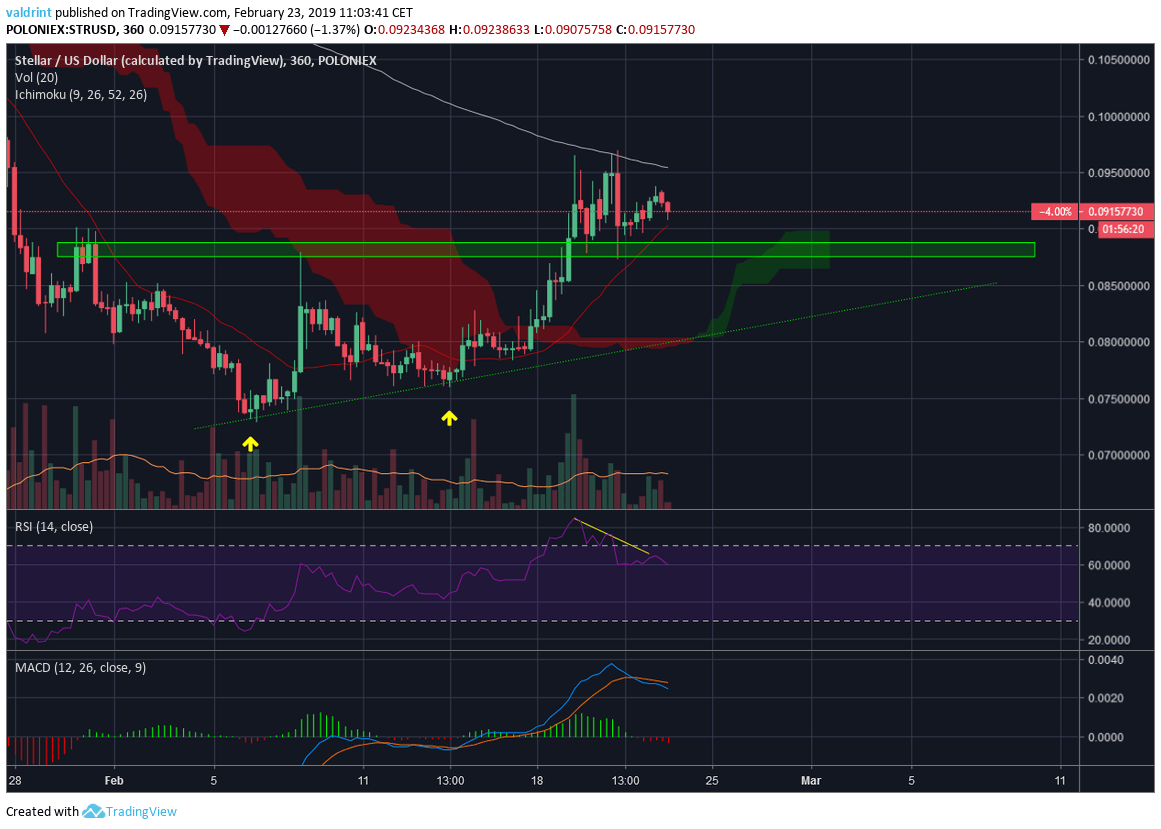 Stellar (XLM) 6-Hour Chart
A look at the 6-hour chart gives us a slightly more bearish outlook.
We can see that price found resistance at the 200-period MA and formed a pattern similar to a double top.
Furthermore, there is a bearish divergence in both the RSI and the MACD, the latter of which has made a bearish cross and is moving downward.
However, the price has broken out of the negative Ichimoku Cloud and is trading above the 21-period MA.
The first minor support area is found near $0.087.
Finally, it is possible that price is following an ascending support line; however, the line has only been validated twice.
Given this information, I am bearish on the short-term.
XLM Price Prediction:
I believe that during the next week price will consolidate, possibly falling to the minor support area, before getting ready for another upward move.
Conclusions
- Price made a temporary bottom slightly above the major support area near $0.06.
- There is a medium-term bullish divergence.
- Price made a double top.
RELATED ARTICLES
MORE FROM OUR PARTNERS
Advertisement
blokt.com is author of this content, TheBitcoinNews.com is is not responsible for the content of external sites.
Our Social Networks: Facebook Instagram Pinterest Reddit Telegram Twitter Youtube


