


Support levels can be extremely important. They are essential when they hold, but they are almost more important when they don’t. As we take a look at Stellar (XLM) and Litecoin (LTC), you will note this idea very much in effect on these charts.
Stellar (XLM)
Price Analysis
- High: $0.20351
- Low: $0.19719
- 24-Hour Volume: $66.95M
- 7-day Percent Change: -26.11%
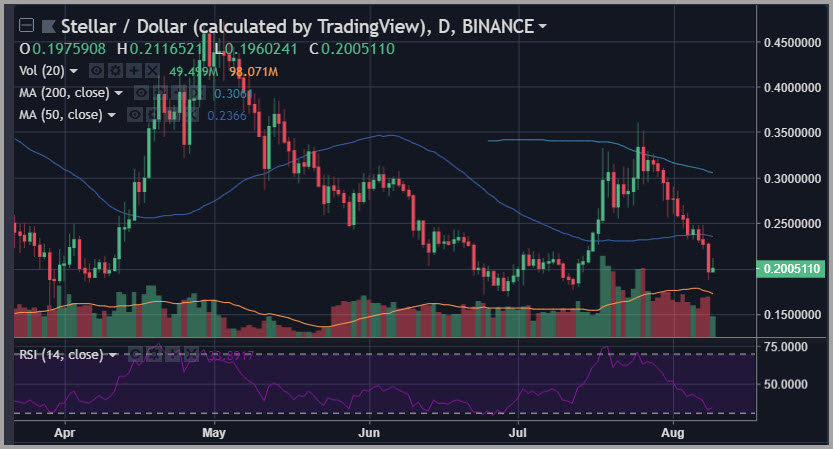
Stellar (XLM) had been a clear outperformer during the July bounce that took hold in the cryptocurrency complex and drove several coins up to test their 200-day simple moving averages.
Hence, we expected to see Stellar (XLM) show some kind of allegiance to its rising 50-day simple moving average as support, especially since it came in confluence with a prior range high price level support.
That type of combination is often hard to break, mainly when you see it in a relative strength market. However, in this case, it doesn’t appear to have been difficult to break at all.
Stellar (XLM) just sliced right down through it.
We are now seeing this chart nearing a test of critical support, and opening up the potential for another bearish technical breakdown if that support doesn’t hold as well. The key levels to watch at this point are lined up at $0.20, $0.18, and $0.17.
Litecoin (LTC)
Price Analysis
- High: $64.223
- Low: $60.433
- 24-Hour Volume: $308.51M
- 7-day Percent Change: -18.61%
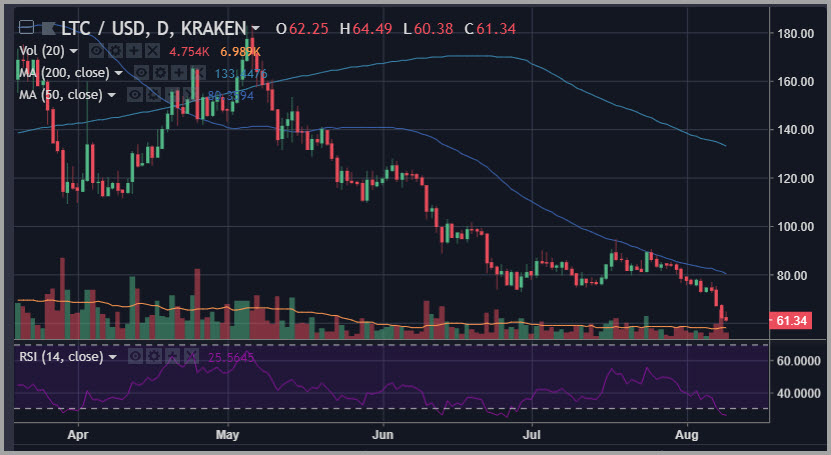
It has been a very rough ride for Litecoin (LTC) over recent days, but there aren’t too many coins for which one can’t make the very same statement.
Litecoin (LTC) broke lower along with everything else last week after finding strong resistance at a sharply declining 50-day simple moving average. That sparked a break under the $80 level, which also represented a sloped support level, and then the waterfall decline began from there.
At this point, the downside that we’ve seen over the last 48 hours is starting to become persistent and dramatic enough that the one bullish factor this chart had in its favor is beginning to melt away: the bullish divergence found on the 14-day RSI measure when compared with the pivot low scored on the charts in late June.
If momentum persists, look for the next major challenge to be at support at the $55 level.
That said, LTC is perhaps at a more advanced point in the rhythm of the bearish trend and may unleash a vicious bounce if the pool of weak-handed HODLers has already run dry.
Happy Trading~
For the latest cryptocurrency news, join our Telegram!
Disclaimer: This article should not be taken as, and is not intended to provide, investment advice. Global Coin Report and/or its affiliates, employees, writers, and subcontractors are cryptocurrency investors and from time to time may or may not have holdings in some of the coins or tokens they cover. Please conduct your own thorough research before investing in any cryptocurrency and read our full disclaimer.
Image courtesy of Pexels
Charts courtesy of tradingview.com
The post Stellar (XLM) Litecoin (LTC) Price Analysis: The Rhythm of the Bear appeared first on Global Coin Report.
Read more at https://globalcoinreport.com/stellar-xlm-litecoin-ltc-price-analysis-rhythm-of-bear/

Globalcoinreport.com/ is author of this content, TheBitcoinNews.com is is not responsible for the content of external sites.
Our Social Networks: Facebook Instagram Pinterest Reddit Telegram Twitter Youtube


