


- Ethereum has corrected with Bitcoin over the past day.
- Both cryptocurrencies have dropped just under 10% from the local highs.
- As of this article’s writing, ETH trades for $408, a price 4.5% lower than it was 24 hours ago.
- Analysts are bearish on Ethereum as the asset has begun to flirt with the pivotal $400 level on a short-term time frame.
- There are technicals and on-chain signals showing that ETH is primed to move lower.
Ethereum Is Poised to Correct Further: Technical and On-Chain Signals
An analyst is having trouble being bullish about Ethereum’s short-term prospects as the asset slides below pivotal short-term price levels. The analyst in question shared the chart below that shows the price of ETH has lost a pivotal moving average that could prove disastrous for bulls:
“Once again H4 25 EMA was a clear short/mid term strength indicator. Lost H4 100 MA and $405-410. Hard to be bullish until this level is reclaimed (or lower level retested), similar to #Bitcoin and W/O – $11,900-12,000. Most likely will sit on my hands. Hard to be bullish “short” term even tho #Bitcoin defending $11,700 and a daily close above $400 on #Ethereum would remain encouraging for at least a bounce/reaction tomorrow.”
Chart of ETH's price action over the past few weeks with level analysis by trader Pierre (@Pierre_crypto0 on Twitter). Chart from TradingView.com
On-chain fundamentals corroborate the expectations of a further pullback for Ethereum after a 10% drop from the highs.
Blockchain analytics firm Santiment reported that Ethereum’s decreasing number of users despite an increasing price is worrying its analysts. The firm explained that this divergence is risking the viability of ETH’s medium-term rally:
“However, on the shorter term scale, our daily active address vs. price model continues to show a concerning lack of unique addresses transacting on the network to sustain its current market cap. Currently, $ETH looks to be outputting its 10th straight day of a bottom 10% signal when comparing its median DAA vs. its median price… [This threatens] the viability of Ethereum’s midterm rally may be put to the test.”
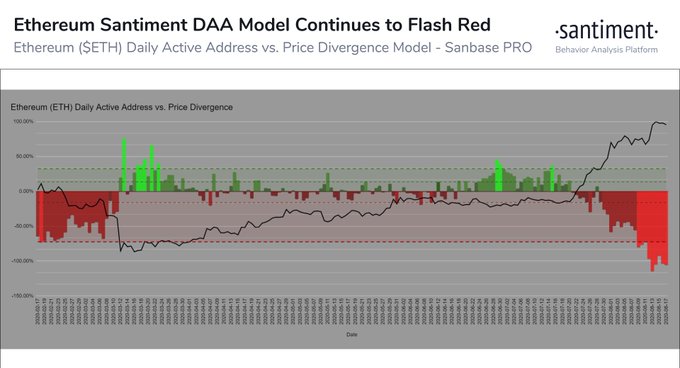
Chart from Santiment, a blockchain analytics firm, that shows Ethereum's daily active addresses vs. the price divergence model. Current as of August 18th.
All Eyes on the Dollar
It seems that Ethereum’s price action, or at least that of the crypto market, is being dictated by the price of the U.S. dollar relative to other currencies. The Dollar Index is up 1% in the past 24 hours and global markets, including gold and equities, have dropped.
The dollar dropping further could fuel more inflows into the crypto market, boosting the prices of Bitcoin and Ethereum.
Featured image from Shutterstock
Price tags: ethusd, ethbtc
Charts from TradingView.com
Why It's "Hard" for This Analyst to Be Bullish on Ethereum as Price Flirts With $400

Bitcoinist.com is author of this content, TheBitcoinNews.com is is not responsible for the content of external sites.
Our Social Networks: Facebook Instagram Pinterest Reddit Telegram Twitter Youtube


