


While the action has been somewhat monotonous over the past several weeks for cryptocurrency traders – down, down, and more down – the picture is actually a little bit more two-sided and interesting when we focus on various large market cap coin pairings, particularly with some interesting coins when paired with Bitcoin.
For example, in the analysis below, we’re going to take a look at two very interesting pairs – BNB/BTC and XLM/BTC. In each case, the relationship between the short-term charts in the longer-term patterns is revealing.
BNB/BTC
Price Analysis
- High: 0.0016965
- Low: 0.0015138
- 24-Hour Volume: 352.194K
- MACD Signal: Sell
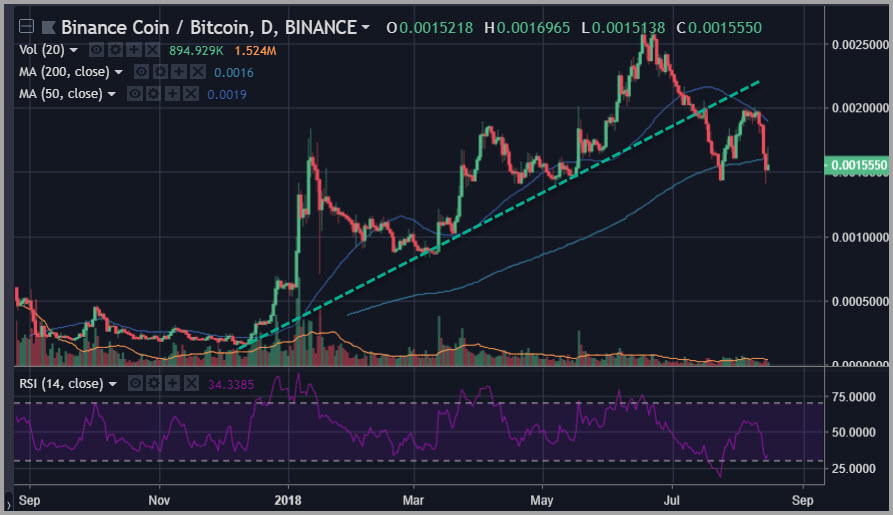
Without a doubt, the BNB/BTC pair is one of the more interesting technical pictures in the crypto complex at present. Binance Coin (BNB) has been one of the sharpest outperformers across the cryptocurrency space since late 2017, consistently outperforming Bitcoin all the way into this summer.
However, as we started to trigger the new phase or leg of this bear market, we are beginning to see some flight to safety which is beginning to cripple the trend in the BNB/BTC pair, knocking this chart down through its 50-day simple moving average to test support at a rising 200-day simple moving average.
In the process, BNB/BTC broke just underneath its 200-day simple moving average, thus registering a deeply oversold reading on the 14-day RSI, which cracked under the 20 level in terms of raw indicator reading.
At the same time, this BNB/BTC chart broke beneath a price shelf defined by the January 2018 highs in confluence with the March 2018 highs. This action also quickly broke beneath a strong trend line that you can see drawn in the chart above.
However, if we begin to see some more adventurous trading reemerge in the second half of the year, the BNB/BTC pair may be a very interesting place to look for speculative outperformance.
XLM/BTC
Price Analysis
- High: 0.0000361
- Low: 0.00003492
- 24-Hour Volume: 126.696K
- MACD Signal: Sell
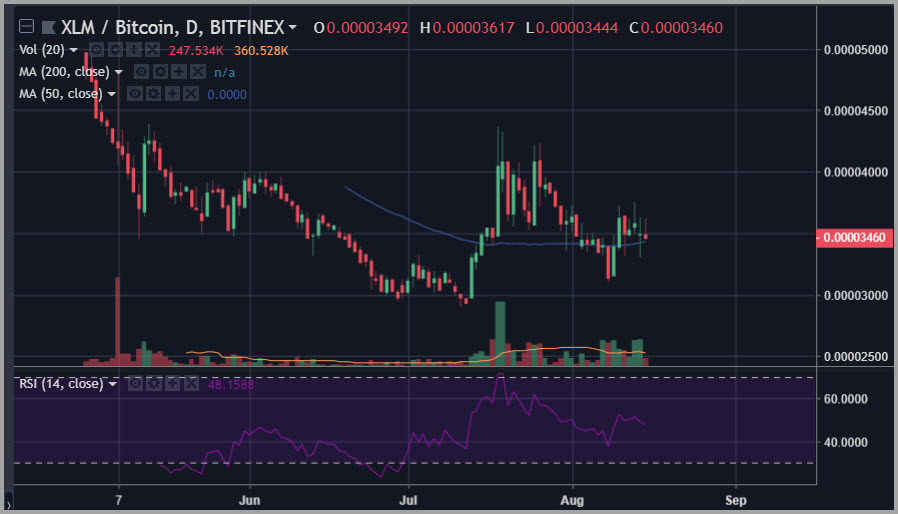
By comparison, the XLM/BTC pair is both thinly traded and wallowing. That said, this pairing is also outperforming many others, with the current price level sitting above its 50-day simple moving average about midway through a trading range defined by the span seen in the mid-July rally shown on this chart.
The essence of the XLM/BTC pattern at present is a symmetrical triangle with the price very near the axis point as we come into the action today.
The triangle nature of this pattern suggests something of a battle between XLM and BTC for the honor and title of “least dirty shirt in the hamper”. In other words, relative to fiat currencies – and especially the US dollar – basically everything in the crypto complex has been plastered over the past three weeks. But the majority of large market cap coins have been similarly plastered when compared with Bitcoin.
But XLM is more or less holding its own, which is clear on the XLM/BTC chart.
Happy Trading~
To trade cryptocurrencies, sign up with BitMex or Binance!
Disclaimer: This article should not be taken as, and is not intended to provide, investment advice. Global Coin Report and/or its affiliates, employees, writers, and subcontractors are cryptocurrency investors and from time to time may or may not have holdings in some of the coins or tokens they cover. Please conduct your own thorough research before investing in any cryptocurrency and read our full disclaimer.
Image courtesy of Pexels
Charts courtesy of tradingview.com
The post XLM/BTC and BNB/BTC Price Analysis: Where to Look for Opportunity appeared first on Global Coin Report.
Read more at https://globalcoinreport.com/xlm-btc-bnb-btc-price-analysis-where-to-look-for-opportunity/

Globalcoinreport.com/ is author of this content, TheBitcoinNews.com is is not responsible for the content of external sites.
Our Social Networks: Facebook Instagram Pinterest Reddit Telegram Twitter Youtube


