


With a steady bearish trend in place characterizing many of the larger market cap coins in the cryptocurrency complex over the past eight days, it is often extremely important to identify pockets of relative strength and relative weakness to gain a tactical edge.
Today, we’re going to look at two coins displaying very different characteristics on their chart: XRP and Ethereum Classic (ETC).
XRP
Price Analysis
- High: $0.41538
- Low: $0.40514
- 24-Hour Volume: $243.86MTechnical Analysis, Charting
- 7-day Percent Change: -8.11%
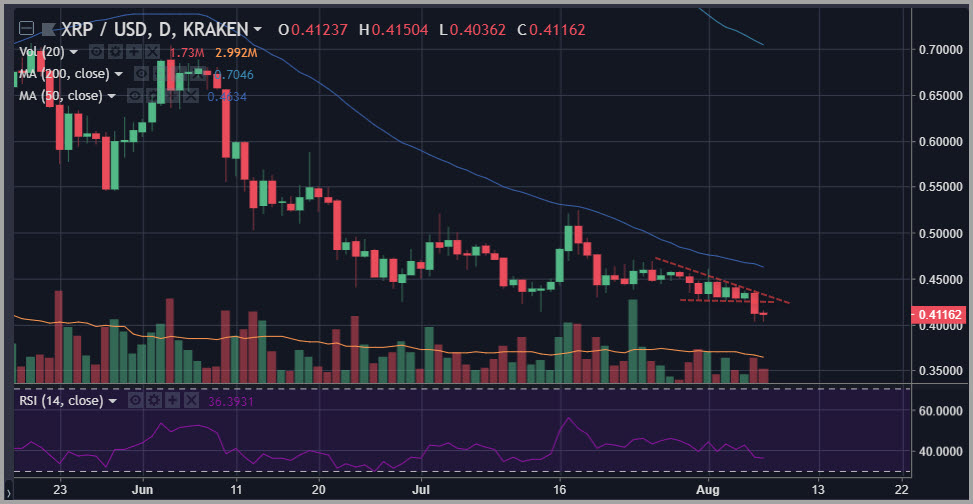
We have documented the critical moment coming into place for XRP over the past month. In fact, in our last piece, we noted that the coin carried a strong potential for a major bearish breakdown if the $0.425 level was taken out on the downside.
Support at that level had been steadfast and staunch for some time, but it finally gave way late yesterday.
At this point, XRP is now in a bit of a no man’s land situation from a technical standpoint, with the major bearish ascending triangle now enshrined on the charts as a breakdown (rather than a hold of support).
From a strictly technical perspective, there does not appear to be much in the way of clear support until we get all the way down to the $0.38 level, which represents the highs in XRP from June 2017.
Ethereum Classic (ETC)
Price Analysis
- High: $20.826
- Low: $18.3494
- 24-Hour Volume: $409.21M
- 7-day Percent Change: 14.28%
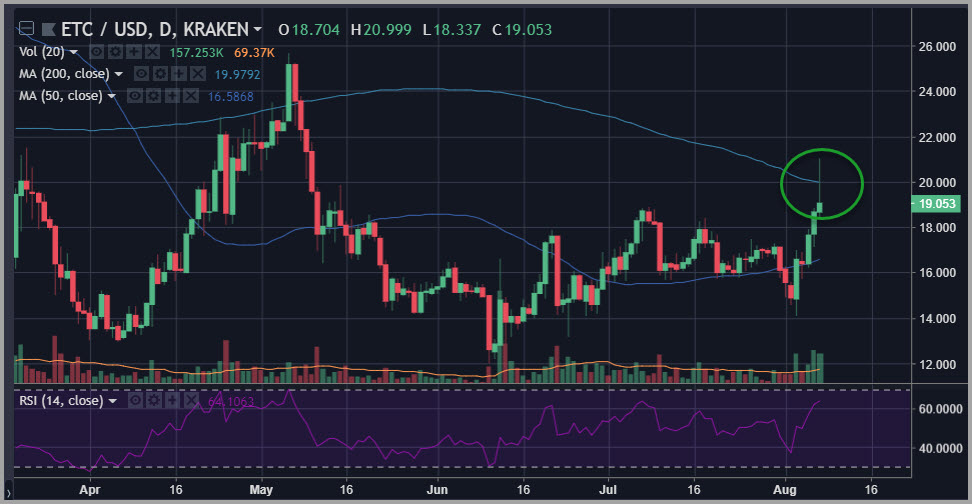
By sharp contrast to XRP, Ethereum Classic (ETC) has been a bastion of powerful relative strength over the past week, breaking out above multi-month range resistance to test its 200-day simple moving average at the $20 level over the past 24 hours.
This action has been fueled by a rash of new exchange adoptions as the coin picks up its exposure for new traders, effectively expanding its reach in the crypto community in terms of raw monetary access to new orders.
The action has been relatively striking, with a four-day move of over 45% in total upside. As we noted, Ethereum Classic (ETC) is facing resistance in the form of its 200-day simple moving average, and also has a 14-day RSI on the daily chart sitting right at the precipice of overbought territory coinciding with a severely overbought MACD indicator on the hourly time frame.
In terms of key levels above, the real test for ETC sits above at the $25 level.
Happy Trading~
For the latest cryptocurrency news, join our Telegram!
Disclaimer: This article should not be taken as, and is not intended to provide, investment advice. Global Coin Report and/or its affiliates, employees, writers, and subcontractors are cryptocurrency investors and from time to time may or may not have holdings in some of the coins or tokens they cover. Please conduct your own thorough research before investing in any cryptocurrency and read our full disclaimer.
Image courtesy of Pexels
Charts courtesy of tradingview.com
The post XRP Ethereum Classic (ETC) Price Analysis: Sweet and Sour Sauce appeared first on Global Coin Report.
Read more at https://globalcoinreport.com/xrp-ethereum-classic-etc-price-analysis-sweet-and-sour-sauce/

Globalcoinreport.com/ is author of this content, TheBitcoinNews.com is is not responsible for the content of external sites.
Our Social Networks: Facebook Instagram Pinterest Reddit Telegram Twitter Youtube


