


As we noted in our analysis yesterday, the technical context for XRP is now wildly different from that which characterizes Ethereum Classic (ETC). In a sense, these are divergent poles in the geography of the cryptocurrency asset class over the past 10 days.
The real question here, if we are to treat this as an asset class, is which of these charts is telling the truth. We will examine the technical information to see if we can answer that question here today.
XRP
Price Analysis
- High: $0.37836
- Low: $0.34072
- 24-Hour Volume: $266.96M
- 7-day Percent Change: -15.76%
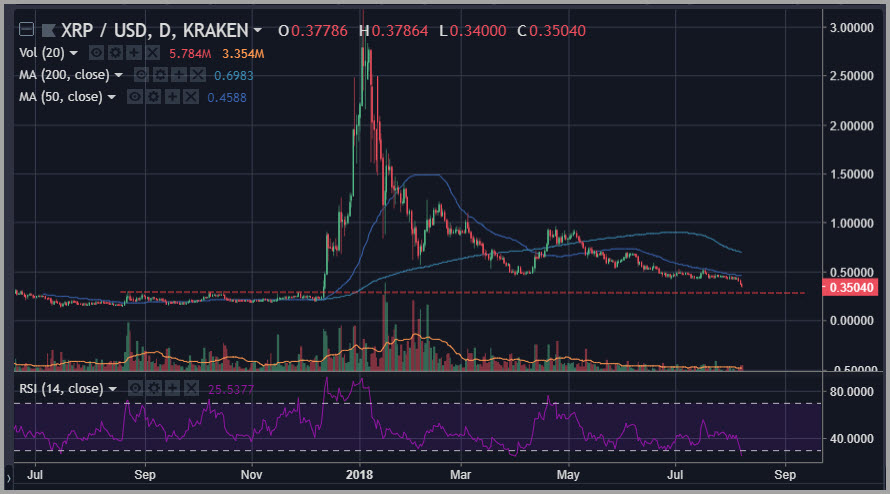
As should be clear by a simple glance at the chart, the technical picture for XRP has viciously deteriorated in recent days.
We had noted the staunch support found along the $0.43 level over the course of about a month, and the potential for that to play a make-or-break role in the evolution of this chart.
At this point, it is clear that the latter choice – “break” – is the one that has emerged to define the pattern right now for XRP.
It is important when doing this analysis that one leaves emotion completely out of the picture and concentrates on the technical facts at hand. In this case, the fact of a bearish descending triangle breakdown is the most salient one. The standard technical target for this pattern, now that the $0.38 level was sliced through like a hot knife cutting through butter, is defined by the range highs that serviced a bullish breakout back in mid-December of last year.
That level is between $0.28 and $0.30. However, this may be overshot on the downside, bringing into play the $0.20 level if the action continues to deteriorate.
That said, in all of this, it is important to remember one of the most critical insights for any successful trader: opportunities tend to ripen when there is blood on the chart.
Ethereum Classic (ETC)
Price Analysis
- High: $17.2755
- Low: $15.5863
- 24-Hour Volume: $605.71M
- 7-day Percent Change: 6.92%
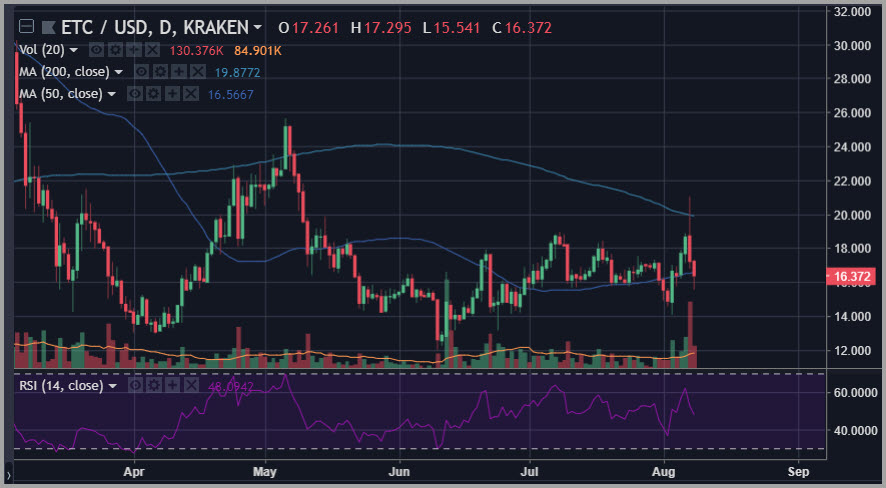
Ethereum Classic (ETC) represents a dramatically different picture. In the real question is: was this chart simply buoyed over the short term by a flow of headline catalysts, and is now ready to join the rest of the cryptocurrency complex in a new leg lower?
Frankly, we should get that answer relatively soon. If Ethereum Classic (ETC) is able to quickly break underneath its 50-day simple moving average at the $16.50 level, that will represent a bad sign. However, even if this is the case, we will still have an important support level just below at the $15.75 level, representing recent range lows formed through the middle of July.
It is also important to understand that a number of key oscillators registered severe overbought levels on the Ethereum Classic (ETC) chart, as we pointed out in our analysis yesterday.
The resistance that has formed on the chart above is now staunchly defined by the 200-day simple moving average in confluence with the psychologically important $20 level.
Happy Trading~
For the latest cryptocurrency news, join our Telegram!
Disclaimer: This article should not be taken as, and is not intended to provide, investment advice. Global Coin Report and/or its affiliates, employees, writers, and subcontractors are cryptocurrency investors and from time to time may or may not have holdings in some of the coins or tokens they cover. Please conduct your own thorough research before investing in any cryptocurrency and read our full disclaimer.
Image courtesy of Pexels
Charts courtesy of tradingview.com
The post XRP Ethereum Classic (ETC) Price Analysis: The Odd Couple appeared first on Global Coin Report.
Read more at https://globalcoinreport.com/xrp-ethereum-classic-etc-price-analysis-the-odd-couple/

Globalcoinreport.com/ is author of this content, TheBitcoinNews.com is is not responsible for the content of external sites.
Our Social Networks: Facebook Instagram Pinterest Reddit Telegram Twitter Youtube


