<!– –>
Markets

Ethereum’s presence has grown rapidly in wealthy regions of the world in the two years since the full launch of the digital currency.
While rival cryptocurrency bitcoin has grabbed most of the attention, briefly tripling in value this year, ethereum’s value has run up a few thousand percent. The digital currency was officially launched on July 30, 2015, and some believe the ethereum network’s ability to support applications could pave the way for a new, decentralized internet.

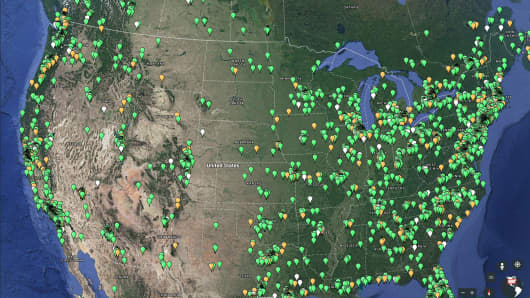
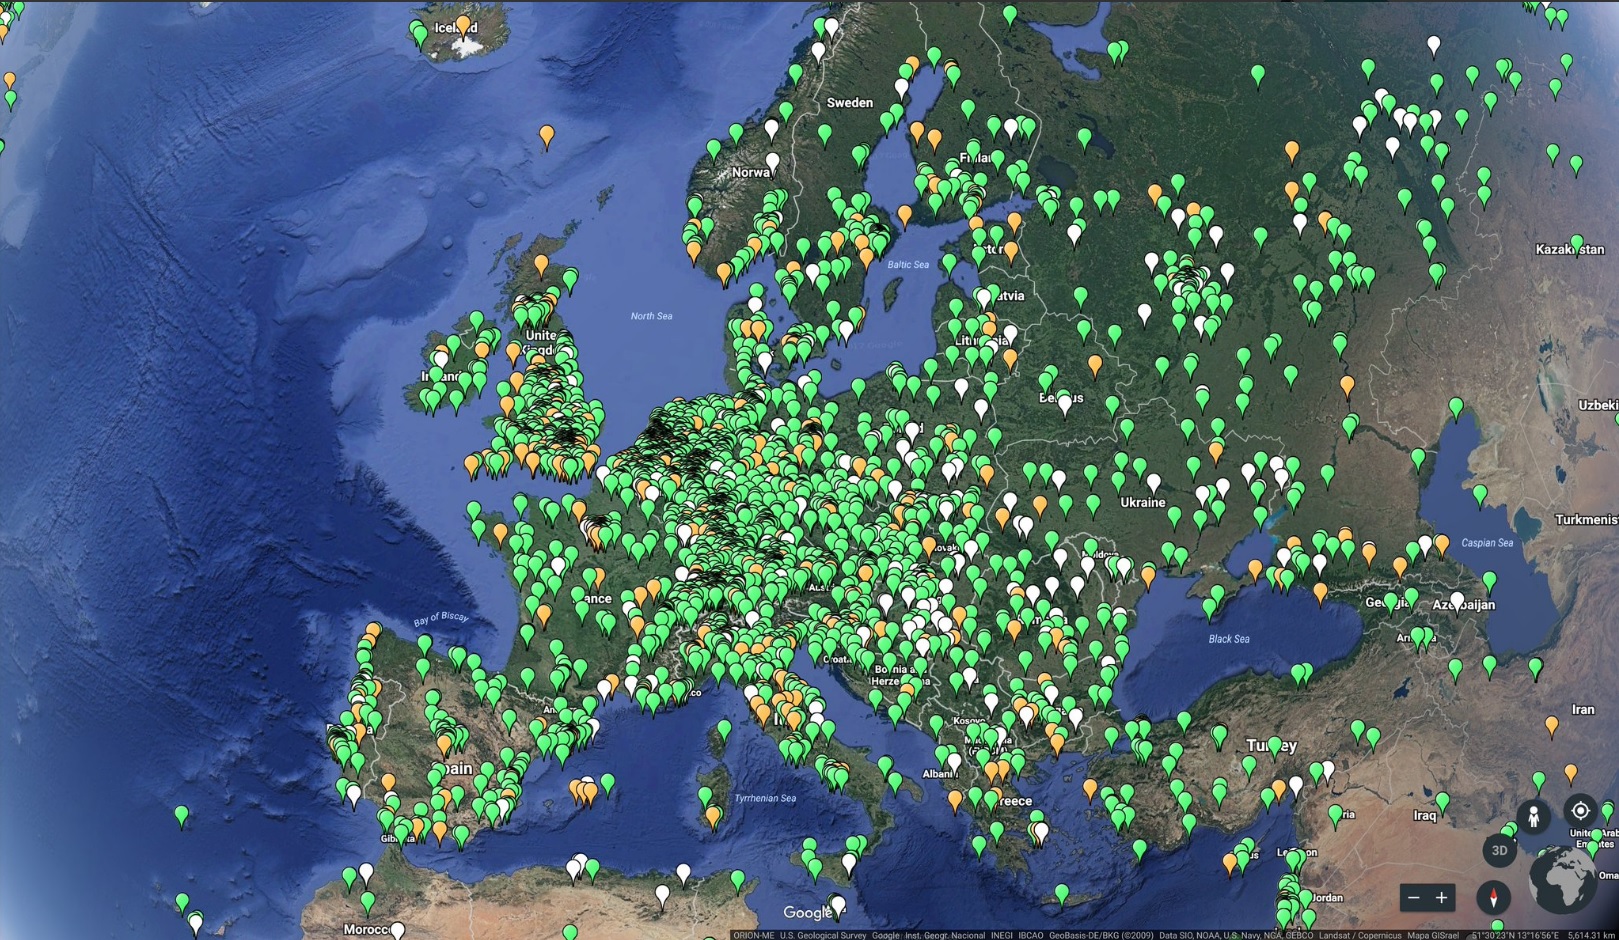
On Tuesday, Peter Szilagyi, head of an ethereum development team, tweeted Google Earth images showing the global spread of ethereum nodes, or computers participating in the ethereum network by executing and recording all transactions in what is known as the blockchain.

Szilagyi created the images by converting the computer Internet Protocol addresses from ethernodes.org into geographic locations and plotting them on Google Earth. He added that the ethernodes project may not include every single node, but the data is “the best we currently have.”
So far, the images show ethereum nodes are more prevalent in the developed world.
“If you compare the wealthier regions like US and EU vs. the poorer regions like Asia and South America,” Szilagyi said in an email to CNBC, “you’ll see that node density seems to go hand in hand with connectivity, industrialization and wealth. My best bet as to why the discrepancy is that running a full Ethereum node is resource intensive.”
Ethereum nodes in Europe

Source: Peter Szilagyi, Google Earth, ethernodes.org
Central Europe is by far the most packed for the nodes. That’s not surprising since the Ethereum Foundation and many other digital currency firms are based in Switzerland.
“Central Europe does seem a bit more saturated than the U.S. for example (without looking at actual numbers),” Szilagyi said. “That might be because Ethereum’s development team is mostly based in Europe, so we’ve had a bit more exposure to Ethereum before it began to spread globally.”
Ethereum nodes in Asia
Source: Peter Szilagyi, Google Earth, ethernodes.org
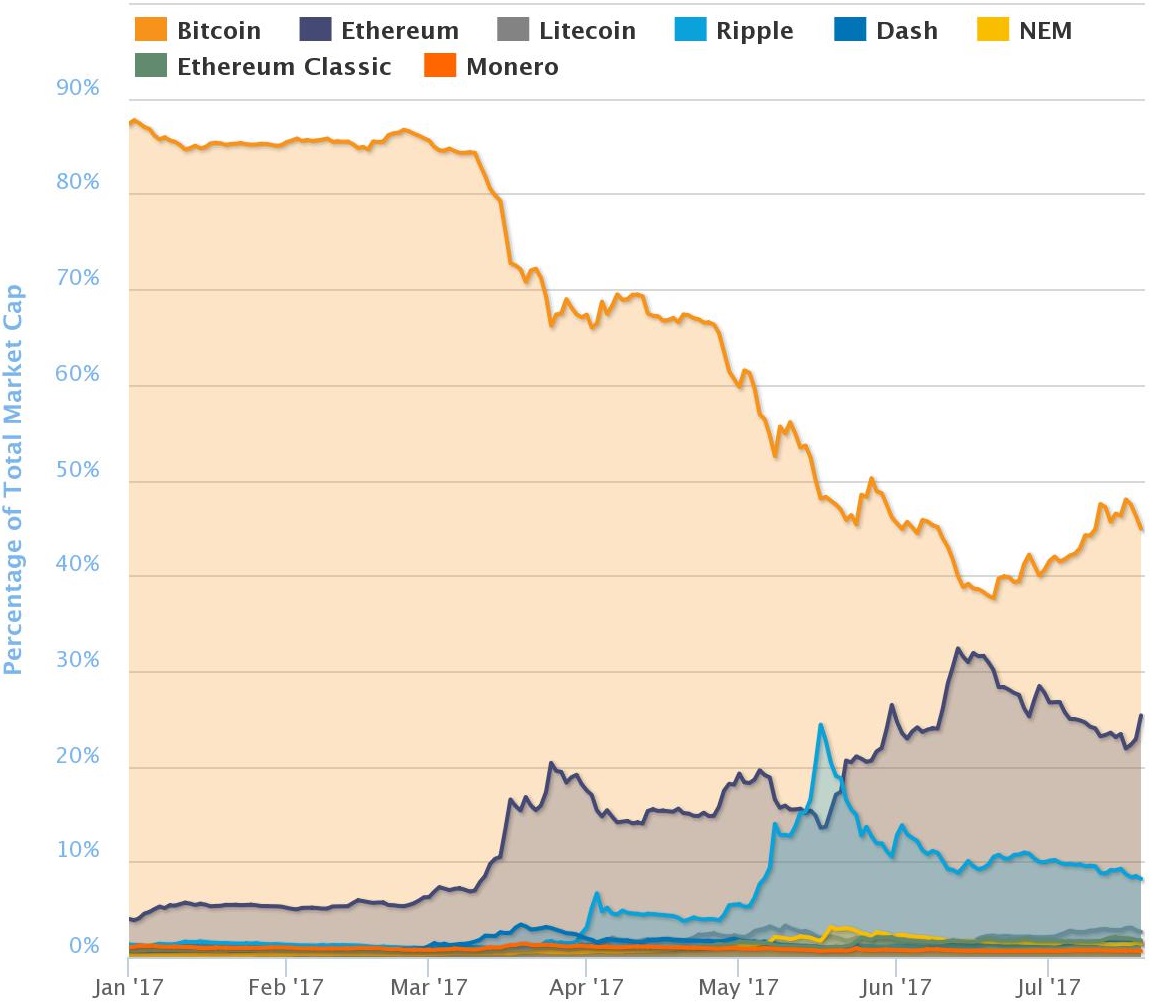
In mid-June, digital currency enthusiasts speculated about a “flippening,” a term used to describe the time when ethereum’s market capitalization would surpass bitcoin’s.
The two currencies came close to that event on June 13, when ethereum had roughly 33 percent of digital currency market capitalization, while bitcoin had about 40 percent.
However, ethereum dropped after some initial coin offerings clogged its network. Ethereum also briefly plunged from above $300 to 10 cents on one exchange in a flash crash on June 21.
As of Wednesday afternoon, ethereum had about 25 percent of digital currency market cap, while bitcoin had 45 percent.
That said, Szilagyi said comparing ethereum nodes to bitcoin nodes is like “apples vs. oranges.”
“The underlying assumptions about them are different, people’s expectations of them are different,” he said.
Digital currency market cap, year to date

Source: CoinMarketCap


Playing
![]()
Share this video…
Watch Next…
![]()
Our Social Networks: Facebook Instagram Pinterest Reddit Telegram Twitter Youtube


