While overall market conditions have improved somewhat over the past week or so as the bleed lower has subsided for now and many cryptocurrencies enjoying a respectable bounce from lower depths, the struggle continues within a challenging environment.
In particular, numerous, if not the majority of coins/tokens continue to trade below their 20; 50 and 200 day moving averages, which paints an unfavorable technical picture as well as confirming the primary trend, which remains lower.
During the past several months, we’ve attempted to provide readers with some clarity as well as levels that both investors/traders could monitor and may find beneficial in attempting to navigate the landscape in the hopes of avoiding the tripping of landmines that have littered the field with an emphasis on risk management via the strict adherence to suggested levels of potential resistance and support of various names.
More specifically, we’ve made it very clear that from a short-term perspective, the 20 day moving average has proved to be a reliable guide throughout these past several months with regards to direction and nothing has changed or altered despite the bump in prices from their recent lows.
With that behind us, let’s take a look at the action of both Ethereum (ETH) and LiteCoin (LTC) in which both continue to demonstrate and validate our reference to the importance of the action surrounding their 20 day SMA via the charts below.
As we can observe from the chart of Ethereum above, ETH continues to trade below its 20 (yellow line); 50 (blue line) and 200 (red line) day simple moving averages. In addition, we can also witness that since mid-May, ETH’s 20 day SMA has provided headwinds/resistance on four (4) separate occasions indicated via the shaded boxes with ETH unable to clear the hurdle and ‘stick/HODL’, thus far.
Therefore, as we’ve noted in numerous previous articles, both investors/traders would be wise in further monitoring of the action surrounding the short-term 20 day moving average, not just for ETH, but for any and all names that investors/traders may be following or have a current position in, for further clues/evidence with respect to direction. Until or unless such conditions/developments change or alter, we’ll continue to place emphasis on the 20 day SMA for short-term purposes.
Moving forward, the following levels may provide both investors/traders with some clarity with respect to direction and may want to utilize as a guide.
If, at any time in the days/weeks ahead, ETH is capable of clearing its 20 day moving average, presently residing at 470 and can ‘stick’, such development, should it materialize, would be and encouraging short-term start. Perhaps more importantly, should ETH go top-side of the 493 figure, such development may then open the door for a potential run into the 500-545 zone, which is where we find the declining 50 day SMA (534ish).
On the other side of the ledger, both investors/traders may want to utilize the 440 as primary as well as the 400-420 zone as secondary levels of potential support.
Nevertheless, ETH remains in a battle for control of its 20 day moving average as we stroke the keys on the keyboard.
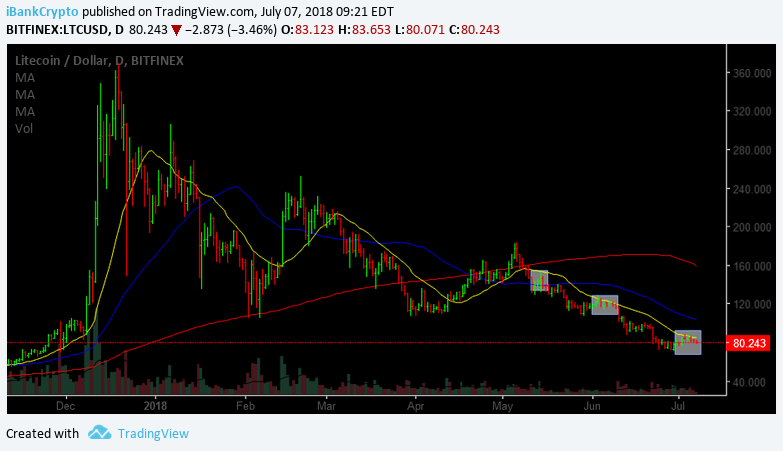
Without being redundant, much like ETC, LiteCoin continues to trade in similar fashion with LTC trading below all of its moving averages and continuing to do battle with its very own 20 day SMA at present evidenced via the daily chart above.
Similarly, LTC has failed on three (3) separate occasions thus far to clear its 20 day SMA since mid-May and finds itself in a struggle as we write.
Moving forward, potential resistance resides at the 90 as well as the 97 and 103 levels, while potential short-term support can be found at the 77-78 as well as 70-73 zone.
Needless to say, both ETC and LTC are presently engaged in a battle royale and continue to find headwinds/resistance at their 20 day SMA’s. Until or unless they can clear that initial hurdle, it will be difficult for either to gain traction as well as upside momentum.
Happy Trading!!
For the latest cryptocurrency news, join our Telegram!
Disclaimer: This article should not be taken as, and is not intended to provide, investment advice. Global Coin Report and/or its affiliates, employees, writers, and subcontractors are cryptocurrency investors and from time to time may or may not have holdings in some of the coins or tokens they cover. Please conduct your own thorough research before investing in any cryptocurrency and read our full disclaimer.
Image courtesy of Pexels
Charts courtesy of tradingview.com
The post Ethereum (ETH) LiteCoin (LTC) Price Analysis – Battle Royale appeared first on Global Coin Report.

Globalcoinreport.com/ is author of this content, TheBitcoinNews.com is is not responsible for the content of external sites.
Our Social Networks: Facebook Instagram Pinterest Reddit Telegram Twitter Youtube


