After anticipating a strong and rapid countertrend rally in the last week of June that we shared on several occasions with readers of Global Coin Report and believed such would commence in the early parts of July, both cryptocurrency investors and traders have been treated to some welcome relief with Bitcoin (BTC) producing a nearly 50% upside move from the depths of despair at the 5700 level and since running up into the 8500 zone.
In addition, after two (2) unsuccessful attempts earlier this year (March & May) to complete inverted Head-and-Shoulders (H&S) formations, only to be rebuffed at the neckline of each, which produced subsequent declines, Bitcoin (BTC) was finally able to get the job done in July when it went top-side of the 6900 level, a level that we had been directing readers attention for close monitoring, as well as the successful completion of the most recent inverted H&S pattern.
Thus, Three Times was indeed A Charm.
Furthermore, with Bitcoin’s successful completion of its inverted H&S pattern, BTC has also fulfilled our noted measured move price objective in the 7800-8000 zone and did so by exceeding the target via its 8500 print, which has since paused/stalled at its declining 200 day SMA.
So, with BTC presently hovering just below its all-important 200 day SMA and appearing to pause/stall, the question begs, “Is the countertrend rally over?”
While we believe it’s premature to declare such rally as ‘Over’ at this particular juncture, let’s take a look at the charts to see what they may be foretelling.
As we can observe above, BTC finds itself consolidating the recent thrust just beneath its declining 200 SMA. However, we can also see that BTC remains well above both its 20 and 50 day SMA’s, which from a short and intermediate-term technical perspective, is a positive, as well as remaining in a healthy posture, for now.
Moving forward, in order for BTC to ‘get going’ once again and resume its northern trajectory, both investors and traders may want to pay close attention to the 200 day SMA located at the 8440ish level as well as the 8510 and 9020 figures as potential overhead resistance levels to be cleared.
On the flip-side of the coin, potential levels of support can be found at the 7800 as well as 7200-7300 zone and perhaps most importantly, the 6800-6900 zone.
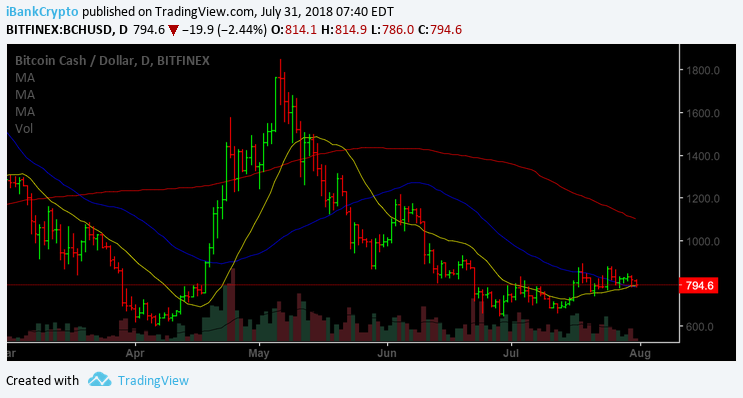
Bitcoin Cash (BCH) has been holding up fairly well, thus far, and has our attention. Although further work is required, both investors/traders may want to pay particular attention to the 890 level for top-side confirmation that things are about to get ‘underway’, while a move below 770 and perhaps more importantly, the 740 figure, would put a damper on the present technical outlook.
As we can witness above, ETH is now starting to breach the lower side of its short-term trendline after coiling for the past several weeks and now finds itself trading below all of its important moving averages (20/50/200 SMA). Thus, we would not be surprised if ETH were to make its way back to the 400 level should it be incapable of turning the tide rather quickly here.
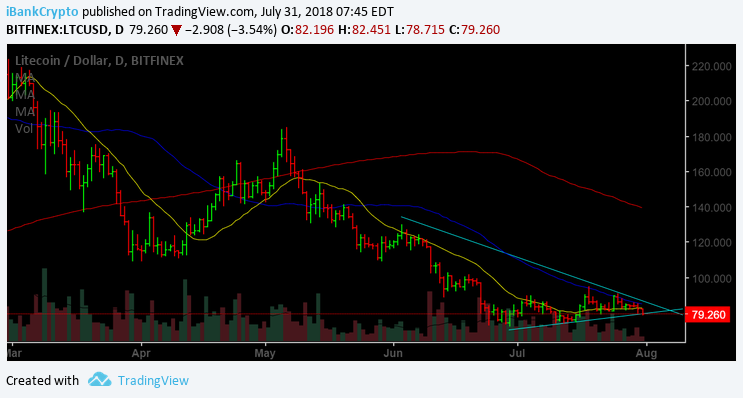
Much like ETH, Litecoin (LTC) is also breaching its short-term trendline to the downside and trading below all of its important moving averages with the 75 figure and 70-72 zone providing potential short-term support.
Cardano (ADA) had found itself trading within a triangle and holding up fairly well. However, as we can observe above, ADA has since violated the lower boundary and once again, finds itself trading beneath all of its important moving averages (20/50/200 SMA).
Therefore, while BTC has and remains in ‘better’ technical shape than many of its brethren, and we’re not ready to officially declare that the forecasted countertrend rally is ‘Over’ just yet, we’re beginning to witness some signs that both investors/traders may need to ‘tighten’ things up and keep their positions on a tight leash, at least those who are trading the short-term gyrations.
iBC~
Happy Trading~
For the latest cryptocurrency news, join our Telegram!
Disclaimer: This article should not be taken as, and is not intended to provide, investment advice. Global Coin Report and/or its affiliates, employees, writers, and subcontractors are cryptocurrency investors and from time to time may or may not have holdings in some of the coins or tokens they cover. Please conduct your own thorough research before investing in any cryptocurrency and read our full disclaimer.
Image courtesy of Pexels
Charts courtesy of tradingview.com
The post Bitcoin (BTC) BCH ETH LTC ADA Technical Analysis – Is The Countertrend Rally Over? appeared first on Global Coin Report.
Read more at https://globalcoinreport.com/bitcoin-btc-bch-eth-ltc-ada-technical-analysis-is-the-countertrend-rally-over/

Globalcoinreport.com/ is author of this content, TheBitcoinNews.com is is not responsible for the content of external sites.
Our Social Networks: Facebook Instagram Pinterest Reddit Telegram Twitter Youtube


