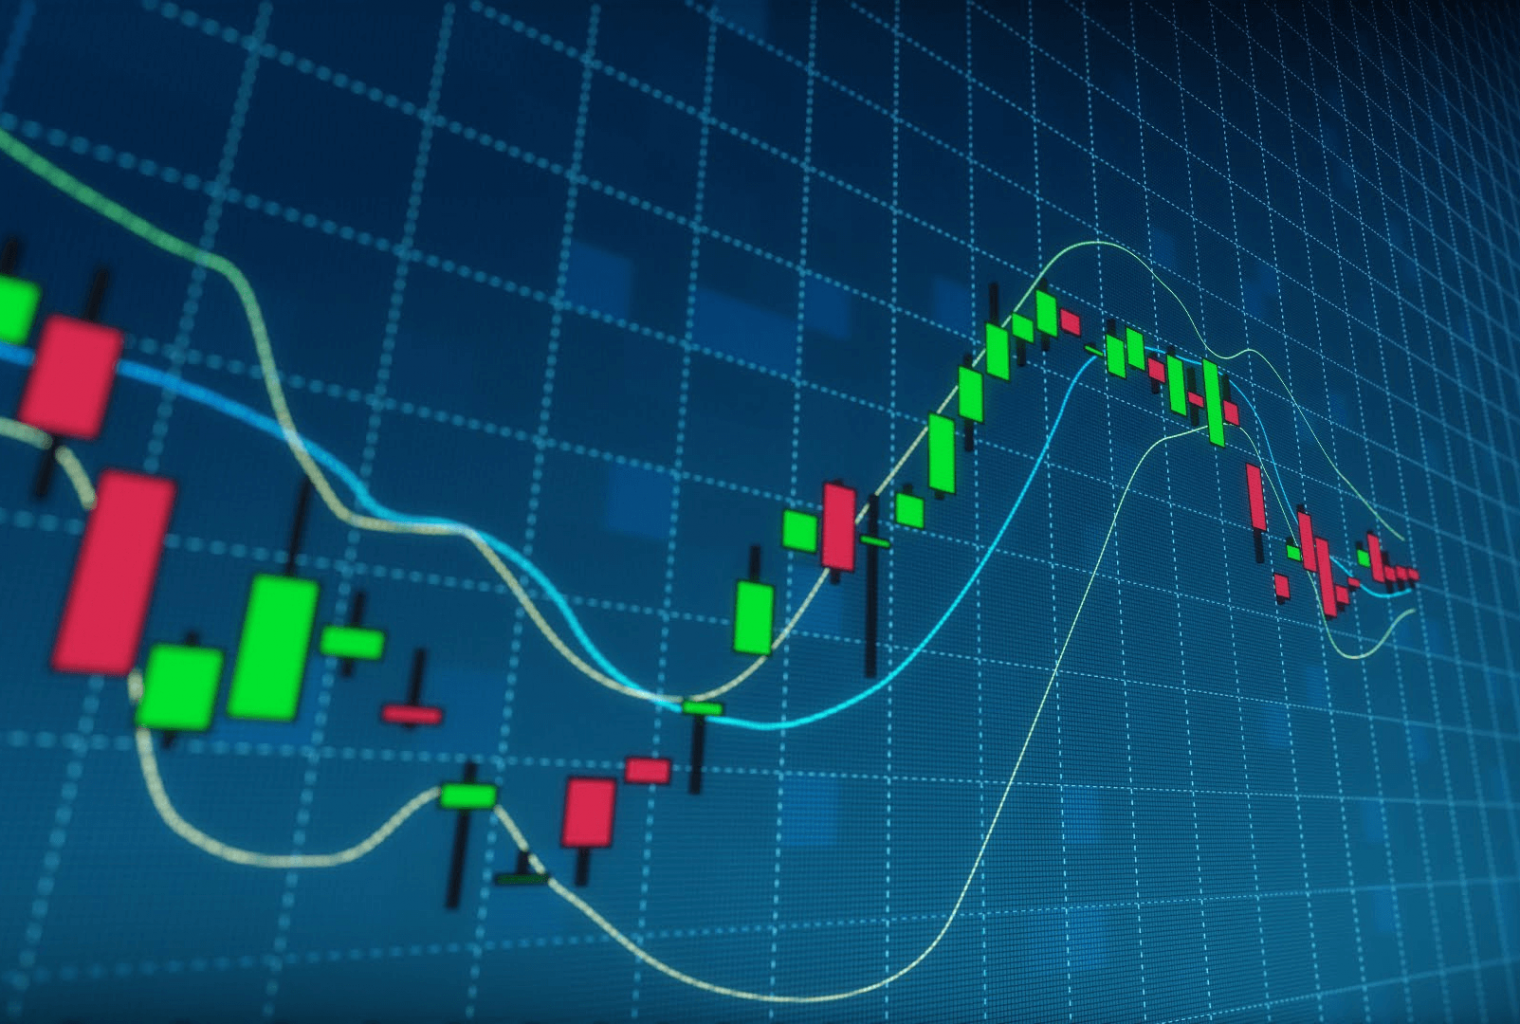
If you’re not what it is called a die-hard or seasoned crypto trader, then you may not know about candlesticks, even though they are considered to be one of the most important tools for crypto traders, when it comes to finding buying and selling areas in crypto charts.
Candlesticks are a big deal in crypto since the investment process goes well beyond simply purchasing a token and monitoring its performance in the market. There’s an unwritten law most expert traders stick by. This law says that not investing at the wrong time is more valuable than investing at the right time.
Most seasoned traders use something called Technical Analysis, a process that takes into account the history of a coin with price charts and trading volumes, irrespective of what the coin actually does. The concept is based on the Dow Theory, which assumes several aspects of the market when assessing its overall performance. Technical analysis often involves candlesticks, and that is why they are important.
What exactly are candlesticks?
To put it as simple as possible, a candlestick represents the price activity of a given (crypto) asset during a specified timeframe. Candlestick charts are one of the most popular types of charts since they carry a lot of information within them.
The price activity a candlestick represents is expressed through four main components: the open, close, high, and low. The “open” component represents the price of an asset when the trading period begins. The “close” component is a direct representation of the price when the period has ended. As expected, the “high” and the “low” components represent the highest and lowest prices achieved during the same trading session.
The information carried by candlesticks is represented by their highs, lows, bodies, wicks, and formations. The body is the wide midsection of the candlestick, and it depicts the open and close component during the observation period. The highs and lows are represented in the second feature of the candlestick known as the “wick.” The wicks are displayed as the thin lines extended above and below the body.
Another characteristic of candlesticks is the fact that they can  become either “bullish” or “bearish.” The bullish sentiment is represented by the color green, while the bearish one is represented by red. The candlesticks become bullish when the current or closing price rises above its opening price. Conversely, candlesticks become bearish when the current or closing price falls below the opening price.
Image source: Bitcoin News
Other candlesticks facts
There’s another type of candlesticks, namely neutral. They represent a moment of market indecision. When this type of candlesticks appears, it’s really hard to guess how the next candles will look like.
As a general rule, bearish candlesticks indicate that at the moment, it’s very likely that the price will go down. Bullish candlesticks indicate that at the moment, it’s very likely that the price will go up. Of course, they don’t indicate how much the price will go up or down.
Candlesticks can be organized by formations as single formation candlesticks, double formation, and triple formation. The single formations are the Spinning Top, Doji, Green Marubozu, Red Marubozu, Hammer, Hanging Man, Inverted Hammer, and Shooting Star.
The double formation candlesticks are Bullish Engulfing, Bearing Engulfing, Tweezer Tops, and Tweezer Bottoms. The triple formation includes Morning Star, Evening Star, 3 White Soldiers, 3 Black Crows, 3 Inside Up, and 3 Inside Down.
Below, we will discuss three of the most useful candlesticks for identifying a potential change in market sentiment or market change. These are the Doji, the Hammer, and the Shooting Star.
The Doji is probably the best candlestick for representing human emotion or market sentiment in regards to an asset. The Doji candlestick represents an indecisive market and is comprised of equal-length wicks and a very thin, centrally located body. It represents the price swings in both directions of an asset’s price before closing near its opening price.
The Hammer candlesticks are formed when price sinks below the open only to later return and then close above the open. This type of candlestick represents that at one point during the trading period sellers temporarily gained control, but then quickly returned it back. The Hammer is comprised out of only one wick, roughly two times in length of the body, which is located at the top of the candle.
The Shooting Star is the exact opposite of the Hammer. It appears at the peak of an uptrend when the bulls rally to start the trading period but typically lose control to the bears who drag prices to a close below the open. It’s comprised out of only one wick roughly two times in length of the body which is located at the bottom of the candle.
Final words
Of course, there’s no perfect way to decide about buying and selling. Candlesticks have a name and indicate either a bearish, a neutral or a bullish market sentiment at the moment when they occur. It’s important to note that candlesticks in crypto charts cannot be used to predict the price on a long-term basis. Candlesticks tell you when certain price shifts will occur.
Featured image: CryptoJH

coindoo.com is author of this content, TheBitcoinNews.com is is not responsible for the content of external sites.
Our Social Networks: Facebook Instagram Pinterest Reddit Telegram Twitter Youtube


