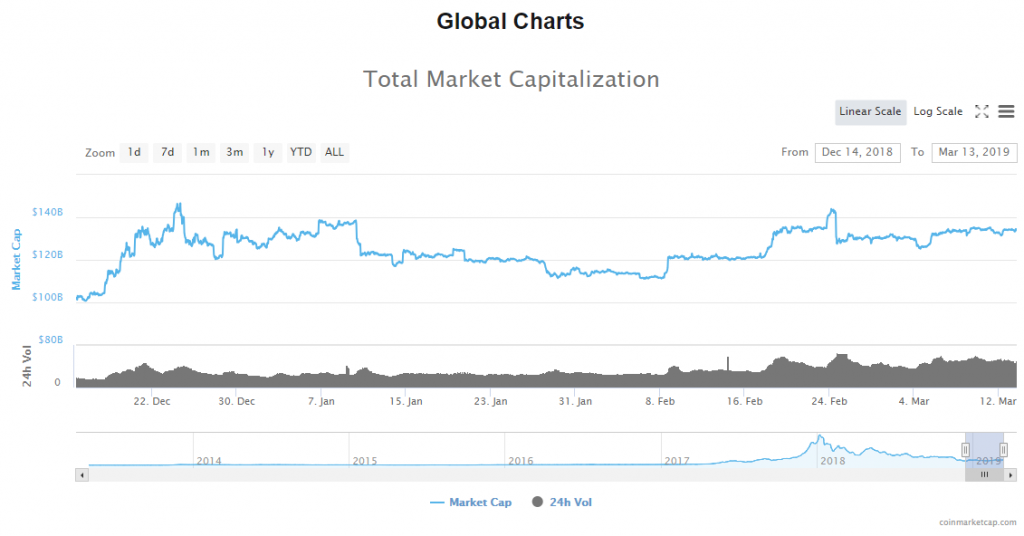
From yesterday’s low at $131,145,945,344 the price evaluation of the cryptocurrency market cap has been increasing and it came up to $134,655,000,000 at its highest point today.
Since then the evaluation has retraced as it encountered resistance and is currently sitting slightly lower than on its highest point today which could mean a minor retracement before a bit more upside.
Read our Guide to Bitcoin Trading Bots to Trade automatically.
The market is mostly mixed in color as the sideways moment continues. The average percentage of change is still insignificant although there are some notable gainers like Bitcoin Diamond with an increase of 19.95% and Komodo with a 12% increase while some of the most notable losers are Theta with a decrease of 17.62% and Revain with 12.52%.
Bitcoin’s market dominance has been hovering around the same levels as yesterday sitting around 51.3%.
Bitcoin BTC/USD
From yesterday’s low at $3907 the price of Bitcoin has increased to $3976 at its highest point yesterday from where the price started declining again and came down to $3925 at its lowest point today still making a higher low than yesterday. The price is currently sitting at $3953 and is still in an upward trajectory which is why today we could see further increase in the price of Bitcoin as the price is still trending upward.

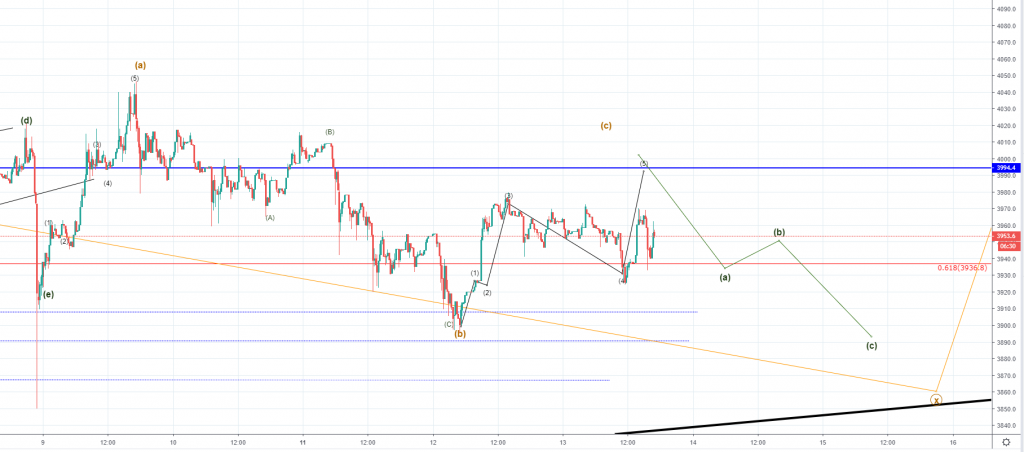
On the 15-min chart, we can see that the price fell to the 0.618 Fibonacci level again today where it found support as it bounced from it recovering to the levels from which the decrease was previously made. This is most likely the 4th Micro wave out of the five-wave move to the upside which the C wave from the ABC correction to the upside. This would be the continuation of the increase we have seen on the 9th of March which is why another minor increase would be expected from here to the vicinity of the horizontal resistance at $3994.4 where the price is most likely to retest the resistance level again.
After this increase ends I would be expecting one more Minuette ABC correction to the downside as the Minute X wave should complete three consecutive ABC corrections. This third ABC would bring the price of Bitcoin lower than the current levels potentially ending on some of the horizontal support levels from the prior horizontal range out of which the lower one is at around $3866. We could see it ending on the ascending trendline which is the support line from the ascending triangle in which the price action is from 15th of December last year but when it ends I would be expecting another increase to the upside above the $3994.4 resistance, potentially ending at around $4200.
Market sentiment
Bitcoin’s hourly chart technical indicators are signaling a sell.
Pivot point
S3 3385.1
S2 3664.3
S1 3840.8
P 3943.5
R1 4120.0
R2 4222.7
R3 4501.9
Bitcoin Diamond BCD/USD
From yesterday’s low at $0.7329 the price of Bitcoin Diamond has increased by 28.7% today measured to its highest point at $0.94318. The price has retraced since and has fallen to $0.89 at its lowest point today but started increasing again and is currently in an upward trajectory sitting at $0.9284.
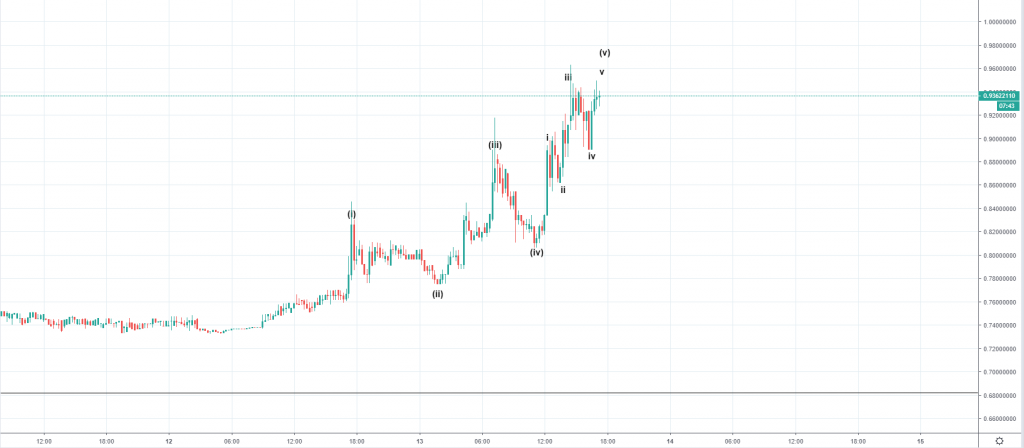
On the 15-min chart, we can see a five-wave impulsive move played out with the current upside movement being the last increase as the Subminute wave 5 should develop fully. As the first wave got extended and the 3rd cannot be the shortest according to the rules of the EWP we could be seeing the completion of the 5th Subminute impulse as it would be the shortest.
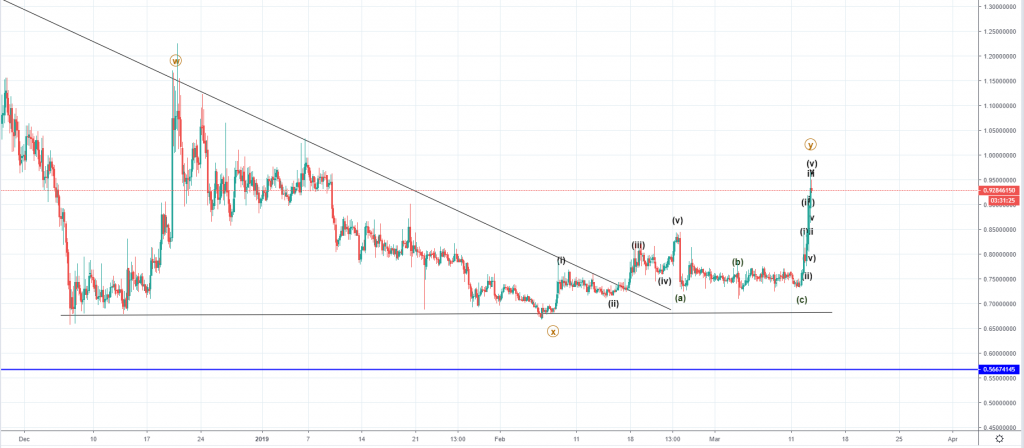
Zooming out to the 4-hour chart you can see that according to my count this was the Y wave from a correction to the upside of a higher degree which means that now that the impulsive move to the upside ended so did the Y wave which means that from here more downside would be expected for the price Bitcoin Diamond.
As the Y wave has completed the third wave we might see an extension with two more waves which could mean that the expected downside move would be correctional and that there is another increase in which case I would be looking at the prior high level at $1.155 where the W wave’s ending point is for a potential target but since this is only correctional when it ends I would be expecting a trend continuation
Market sentiment
Bitcoin Diamond’s hourly chart technical indicators are signaling a buy.
Pivot points
S3 0.59753390
S2 0.67311280
S1 0.71217686
P 0.74869170
R1 0.78775580
R2 0.82427060
R3 0.89984950
Conclusion
The market has been moving sideways still but we have seen some bullish price action in the last 24 hours. Now that the price of Bitcoin getting close to its significant resistance and that the market made some recovery from yesterday’s low most likely we are to see a minor retracement before a corrective increase.
The chart of Bitcoin Diamond looks like it is slightly ahead which could serve as an indicator of how the price action is going to play out for the major cryptos.
The price of Bitcoin is expected to increase a bit further from the current level, reaching its significant resistance at $3994.4 before a minor retracement to the $3866 before going up again to its most significant resistance area at around $4200.
The post Bitcoin Price Analysis: Sideways Still, Is Bitcoin Diamond an Indicator of Future Action? appeared first on Blockonomi.

Blockonomi.com is author of this content, TheBitcoinNews.com is is not responsible for the content of external sites.
Our Social Networks: Facebook Instagram Pinterest Reddit Telegram Twitter Youtube


