A new bearish wave started on July 2nd, with Bitcoin losing $300 over a period of two and a half hours.
Bitcoin’s hourly addresses reached a 2-year high on that day, and hourly active addresses also hit a new yearly high, according to data from Glassnode.
However, this rise in addresses managed to coincide with the $300 crash in Bitcoin’s price, with the market cap of the leading coin losing $4 billion over the past several hours.
Indicators Show the Start of a New Bearish Season
For the past two months, Bitcoin has exhibited a sideways trading pattern, although the recent pressure is in favor of the sellers. The coin rose to $9,780 on June 22, but then in the following days it dropped once again, currently trading at $9.134,94 according to Coinmarketcap data.
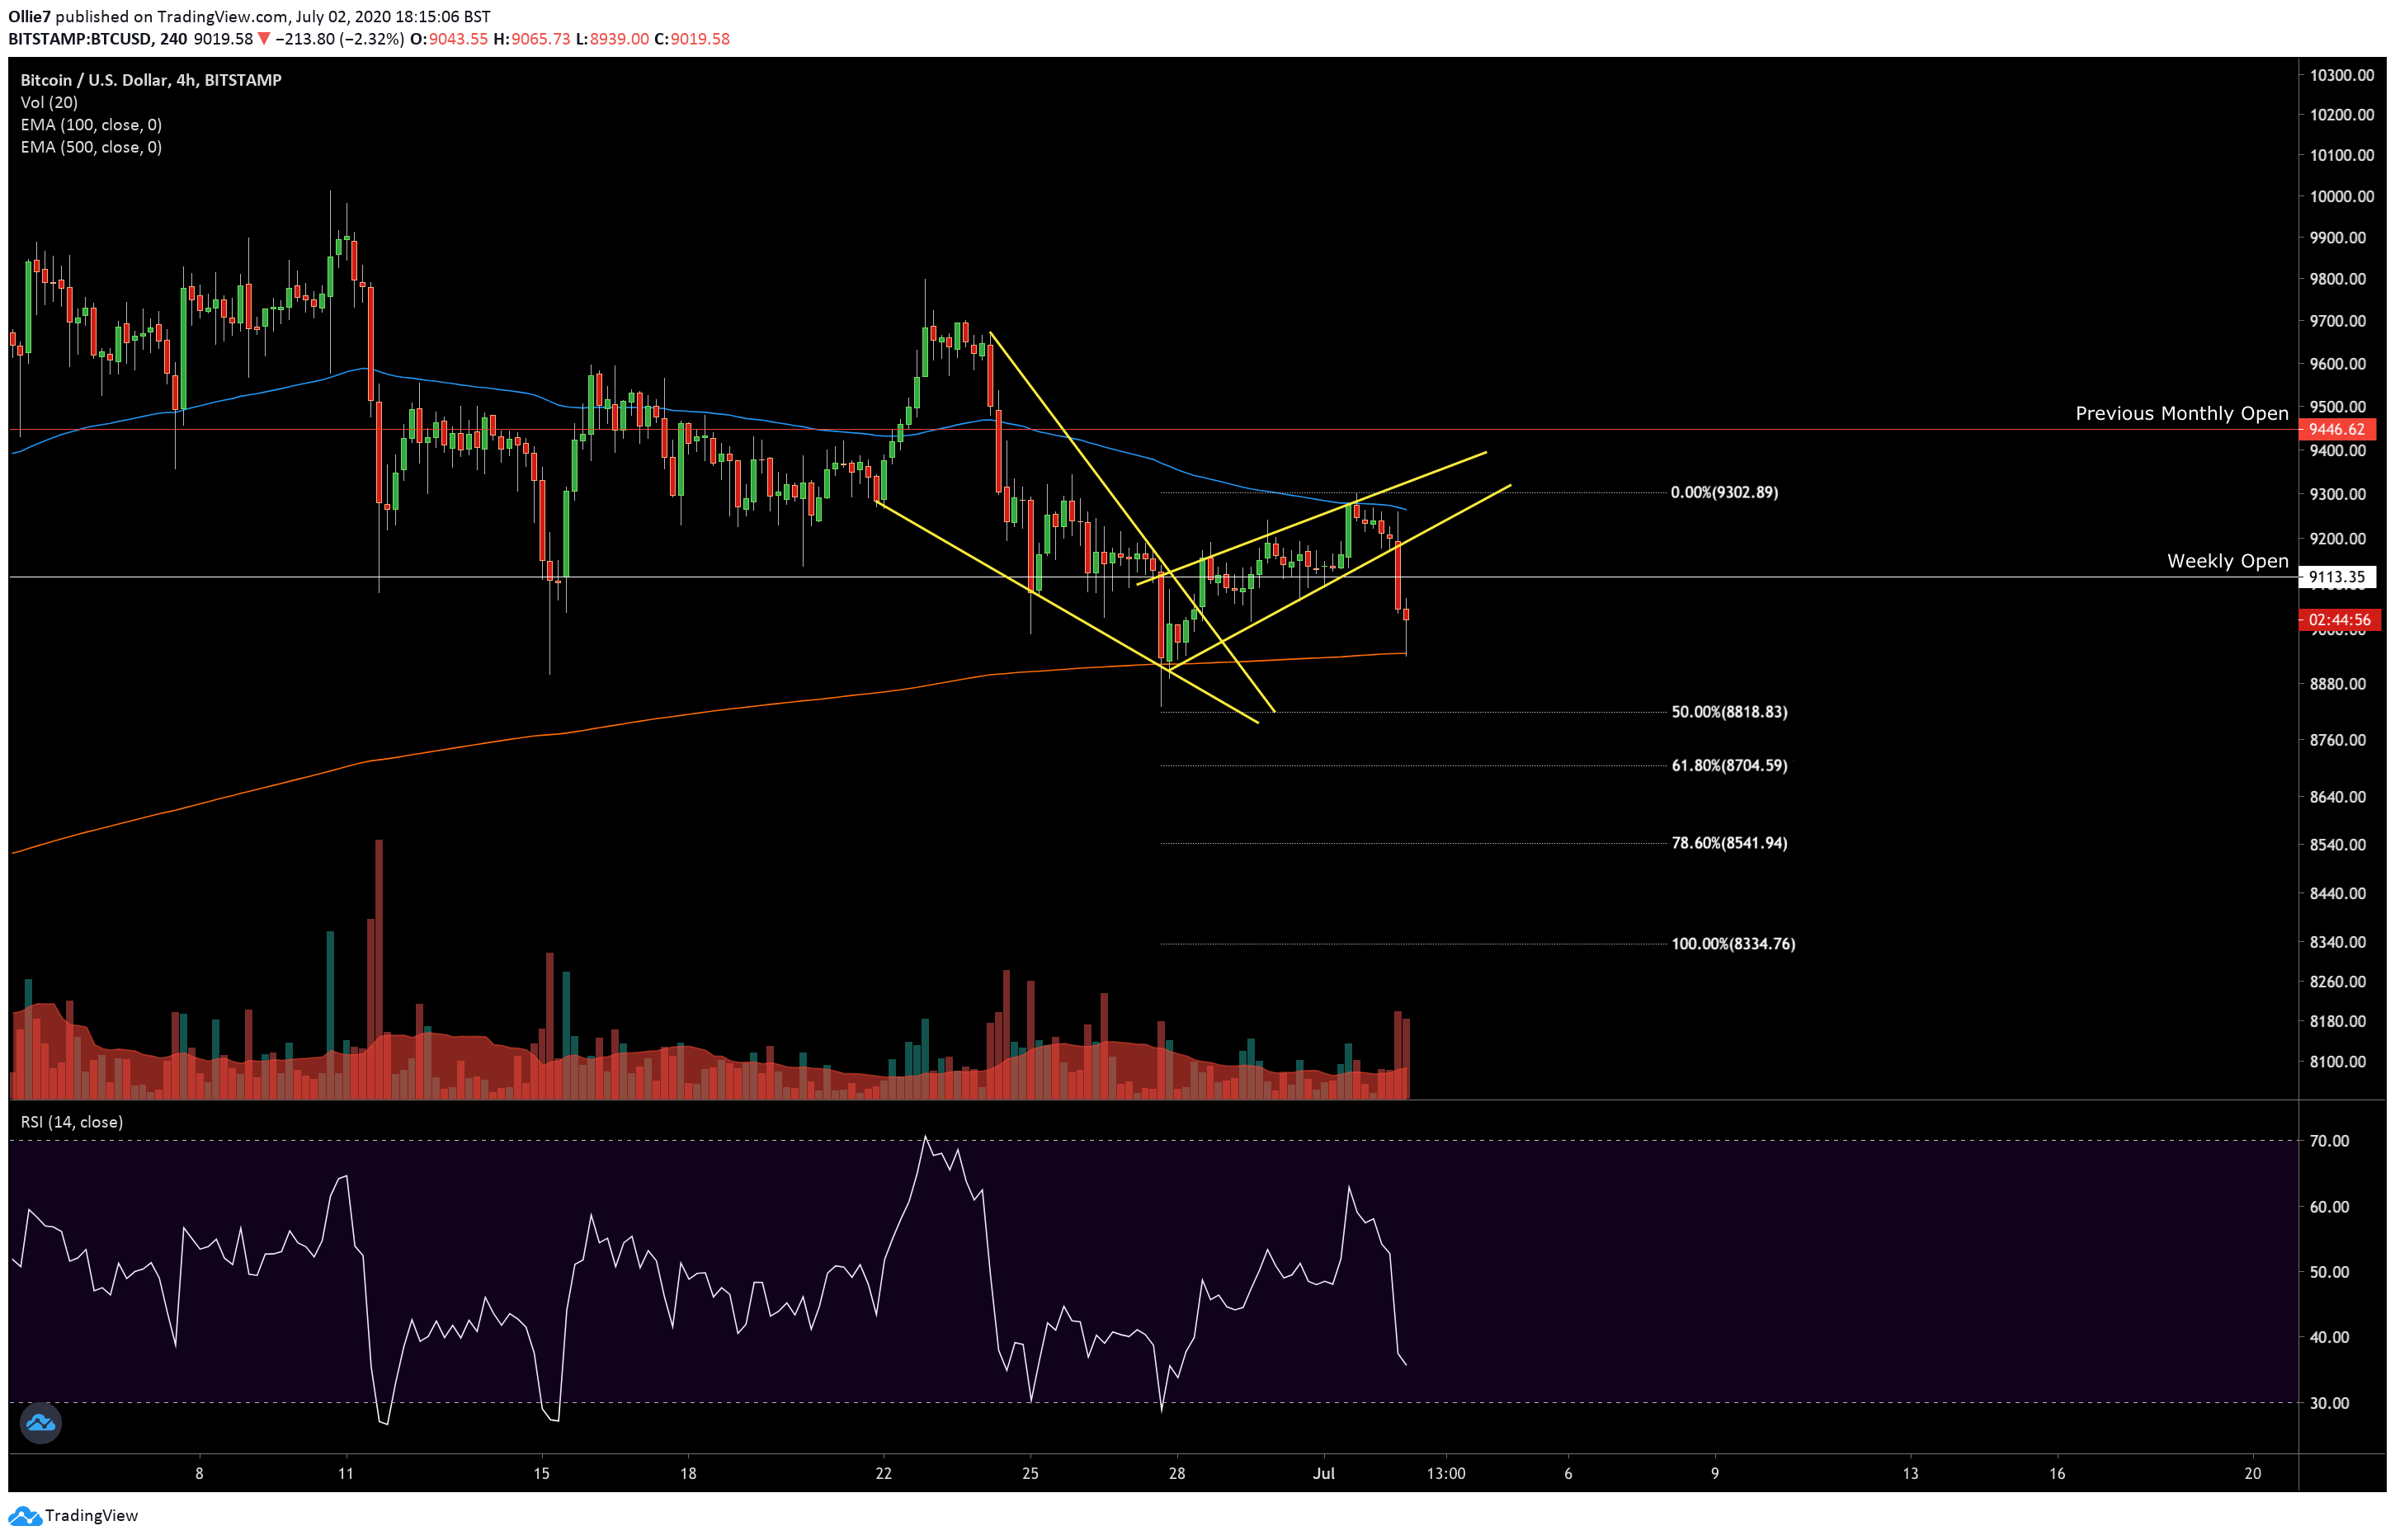
From this BTC/USD chart, it can be noticed that the price action has entered a bearish side, out of a rising wedge pattern.

The sudden increase in selling pressure pushed Bitcoin over the weekly open support (white line) at $9,113 down below the 500-EMA (marked red) support, which is around $8,944.
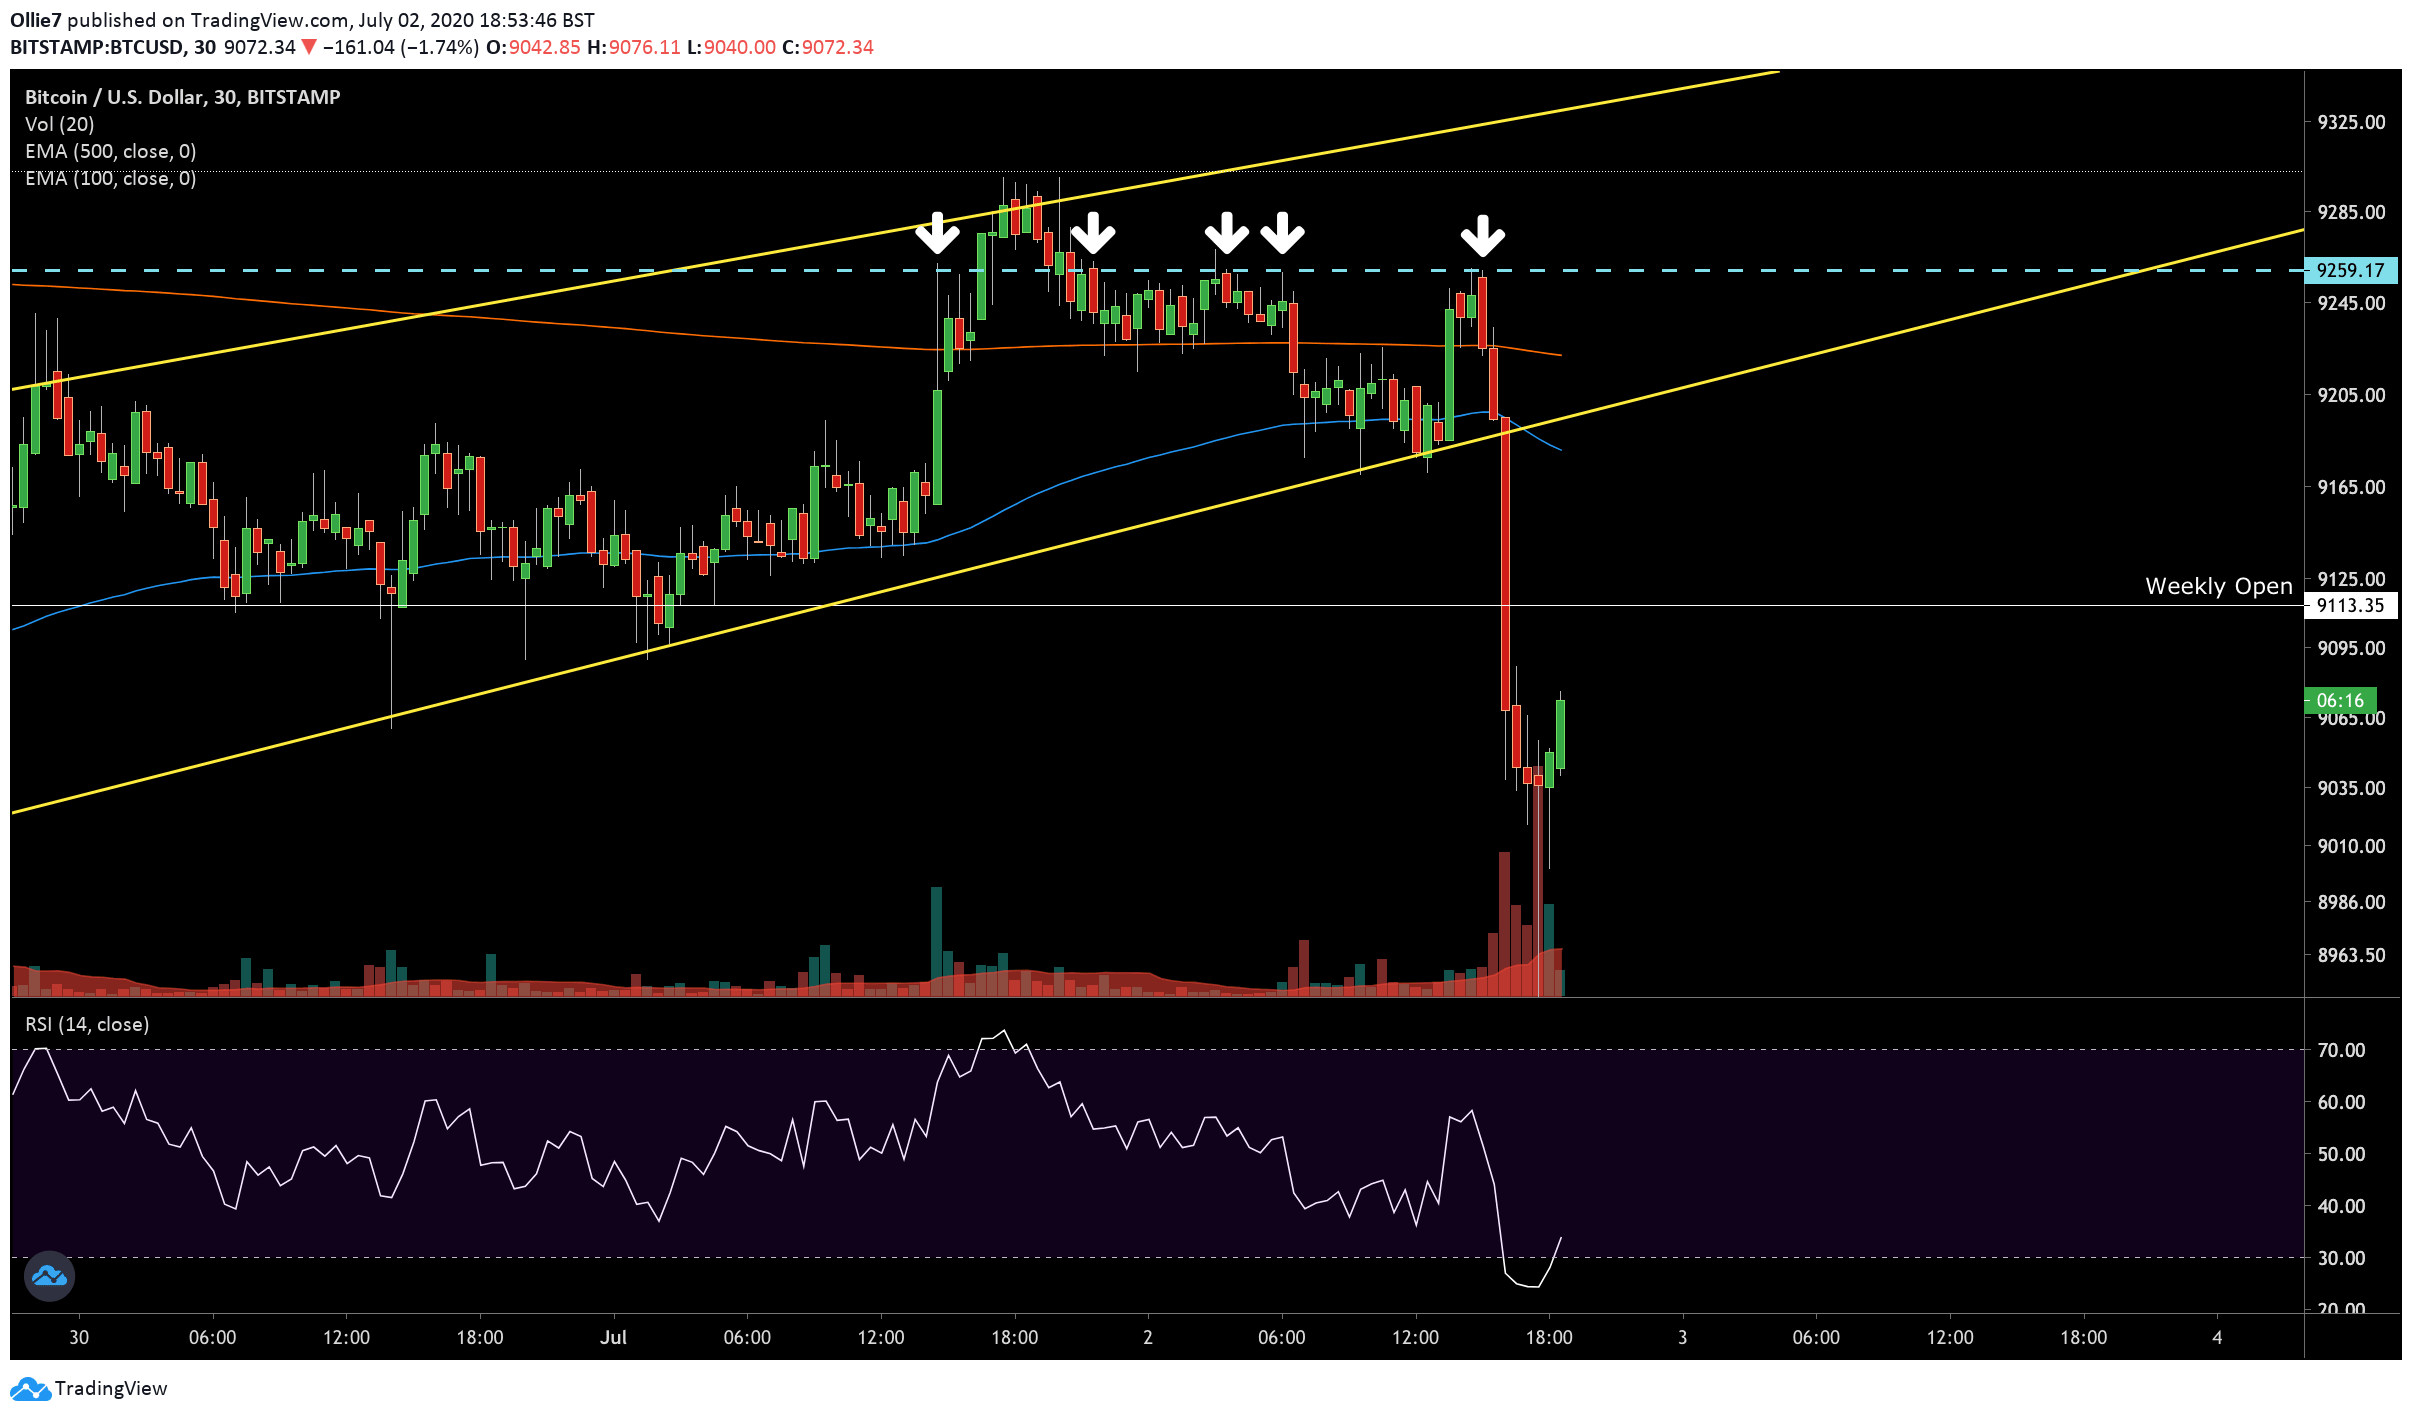
Before the bearish descent, the bulls seemed pretty active, retesting the 50-EMA (blue line) two times, but the market sentiment abruptly changed after they did not manage to pass through the strong $9,260 resistance for the 5th time (as noticed on the 30-minute chart below).
Currently, the price levels at which Bitcoin will face the most resistance against any short-term uptrend will be the price at which the coin opened this week $9,113, and somewhere close around the $9,200 level if Bitcoin price goes back down to the previous support level of the rising wedge pattern (yellow line).
It can be noticed that there is some support at the psychological $9,000 level and back at the 500-EMA level based on the lower levels. However, specialists speculate that there could be a second selling movement that will occur once bears renew their forces from the recent drop. Should this happen, the Bitcoin sellers could be targeting the $8,800 level for the short-term target, a price that previously served as support and the 0.5 Fibonacci extension level.

“Bitcoin is likely to head for a re-test of the daily MA 200, after breaching, retesting and getting rejected at the upslanting trendline from the March 20 peak, May 10 lows and beyond” stated crypto analyst and Twitter personality BigCheds from CNBC Africa on July 2.
The 200-day moving average pointed out by BigCheds is currently placed at $8,360. The trendline served as a price resistance for Bitcoin on March 20, when it was trading around $6,980. The same trendline acted as support on the flipside on May 10, near $8,100.
Bitcoin recently passed through this trendline to the downside and started retesting this level as a new resistance.
Bitcoin managed to come back from under $9,000 once again on July 2nd and restored its position at this level by press time.
Are the Miners the Reason for Bitcoin’s Price Drop?
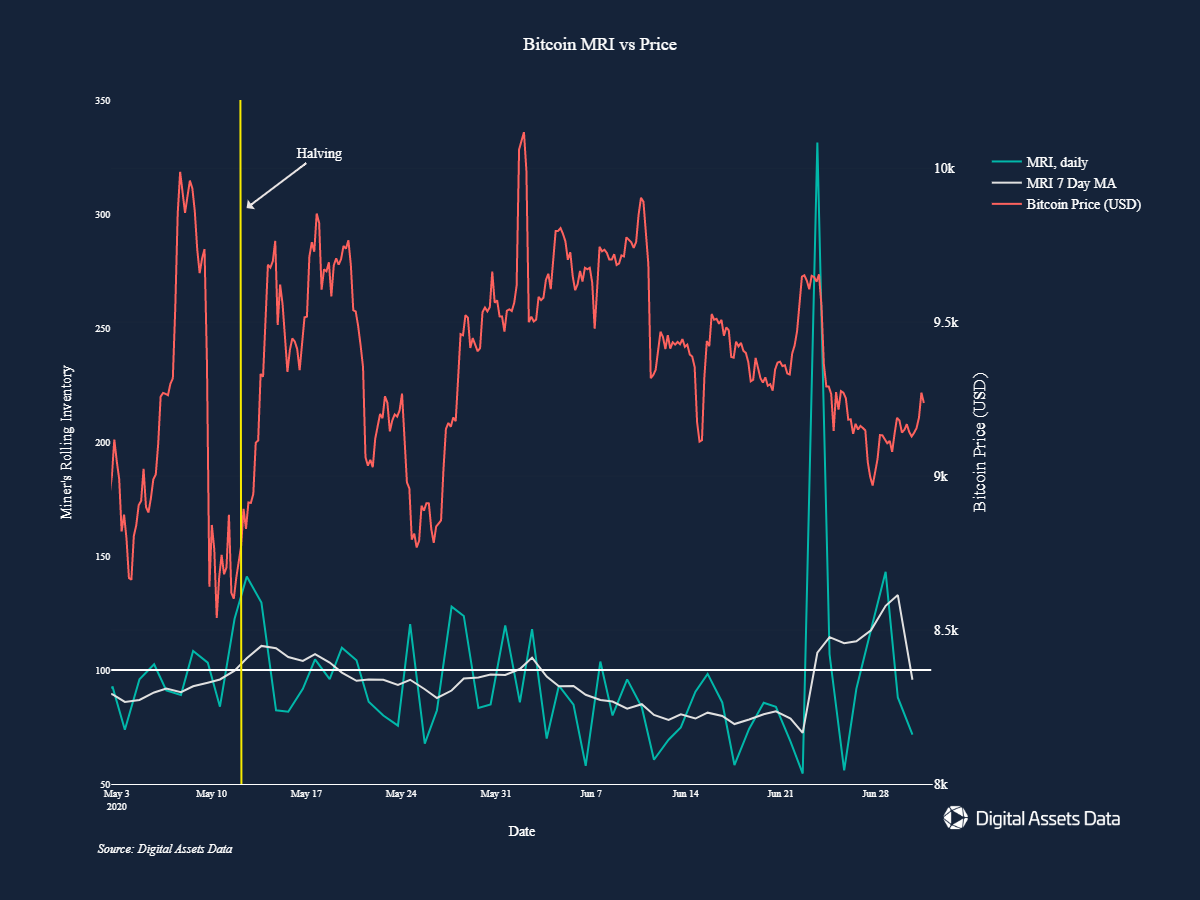
The co-founder and CEO of data analytics outfit Digital Assets Data, Mike Alfred, has recently suggested that Bitcoin miners might have had some influence in the recent price fluctuations of Bitcoin (BTC).
“It is tough to say definitively, but it appears as though the miners’ actions are having a direct, immediate impact on price,” Alfred stated on July 1.
“This is especially evident during outlier events like on the 23rd, where we saw miners offload >300% more BTC than they mined that day,” he stated referring to bitcoin’s price movement on June 23.

“Rolling MRI (Miner’s Rolling Inventory) has declined significantly since the halving, meaning that miners are holding onto more BTC than they are mining”, Alfred said on June 18, pointing out to a significant rise in the mining difficulty of the Bitcoin chain. However, he noticed that a few days later, on June 23rd, the MRI went up.
In theory, this would suggest that there is a greater emphasis on selling from miners, which might explain why Bitcoin’s price descended so abruptly.
On May 11th, Bitcoin went through its third halving, which reduced the mining reward of the Bitcoin block. This means miners now receive 6.25 BTC instead of the 12.5 BTC they previously made when discovering a new block. Many analysts and traders expected that miners might start selling their BTC, as mining would not be profitable any longer for them because of the reduction in block reward.
From past historic charts, Bitcoin has surged prior to its halving, and after the event, a bearish period took place. Bitcoin then significantly rises in price around a year after the halving, which is what most crypto traders hope will happen this time as well.
Featured image: TechCrunch

coindoo.com is author of this content, TheBitcoinNews.com is is not responsible for the content of external sites.
Our Social Networks: Facebook Instagram Pinterest Reddit Telegram Twitter Youtube


