Bitcoin and gold are regularly compared due to the similarities they share. But could those same similarities be the reason for each asset’s price charts forming the exact same continuation pattern?
Across two very different timeframes, both the cryptocurrency and the precious metal are forming a cup and handle. But what exactly does this mean for the market for the rest of 2020?
Crypto And Precious Metals Compared Shows The Same Continuation Pattern
Since mid-March, markets have been on an almost non-stop ascent. As the dollar fell to multi-year lows, its weakness allowed other top assets to shine.
Few assets have performed as well as Bitcoin, but gold was right behind it. Major stock indices and silver also saw a strong climb due to the dollar’s decline. But a recent rebound beginning in the dollar sent these assets tumbling to current prices.
Sentiment across the market quickly turned from extreme greed to fear, but technicals reflect an overheated market cooling off before its next major move higher – at least in precious metals and cryptocurrencies.
RELATED READING | CHECK OUT BITCOIN AND GOLD’S “UNCANNY” CORRELATION DURING POWELL SPEECH
Bitcoin and gold performed among the strongest this year out of all mainstream assets classes, at some points offering neck-and-neck year-to-date performance. The two assets are also forming a very similar cup and handle pattern that could send prices soaring higher.
But how long will it take for the pattern to confirm, and do the comparisons really make sense when they’re taking place across such different timeframes?
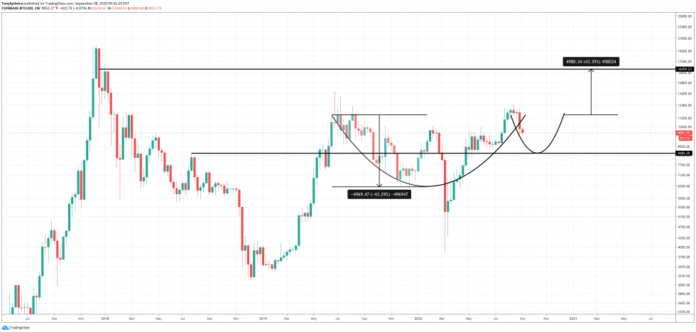
BTCUSD Weekly Cup And Handle Continuation Pattern | Source: TradingView
Cup And Handle Pattern Confirming Targets $16,000 in Bitcoin, $3,000 For Gold
On weekly timeframes, as pictured above, Bitcoin has developed a rounding bottom pattern, which matches up with a potential cup and handle chart formation. The only thing that’s missing, is the rest of the handle.
Cup and handle patterns typically see a handle that is a roughly 30 to 50% retracement of the uptrend to highs. After a short pullback to former support, consolidation takes place and then rises once again to complete the pattern.
RELATED READING | GOLD NEARS SHORT-TERM TOP, RAISING TWO POSSIBLE SCENARIOS FOR BITCOIN
Coincidentally, digital gold’s physical counterpart also is forming a massive cup and handle chart pattern. However, on XAUUSD charts the pattern has developed over the course of several years on the monthly timeframe.

XAUUSD Monthly Cup And Handle Continuation Pattern | Source: TradingView
The main difference between these markets, is the fact that the wild west of crypto never sleeps, while gold traders take holidays and weekends off. Could the disparity in the number of overall trading hours in each market, be due to crypto trading at light speed compared to the aging archaic asset’s market hours?
It is possible, but whatever the cause, it is clear that the two assets are showing similar performance. Gold recently set a new all-time high, while Bitcoin broke above $12,000 where it was rejected. The two assets taking a breather before more upside is extremely healthy in the long term, and very different from Bitcoin of 2019 that saw a 300% rally in three months, followed by another six-month downtrend.
The handle formation could take gold years to complete, while Bitcoin moving at lightning’s pace, will reach its target and complete the formation before the start of 2021.
The target of the pattern in gold would send the precious metal soaring toward $3,000, while Bitcoin would aim for targets above $16,000. Will this cup and formation pattern play out? Depends on if your cup is half full, or half empty, and what the market decides in the days ahead.
Featured image from Deposit Photos.
Charts from TradingView.

Bitcoinist.com is author of this content, TheBitcoinNews.com is is not responsible for the content of external sites.
Our Social Networks: Facebook Instagram Pinterest Reddit Telegram Twitter Youtube


