


Bitcoin, experiencing bull run, moved beyond $7300 USD and shows positive signs.
Bitcoin Cash showed a decline after reaching the $840 level and is correcting its position.
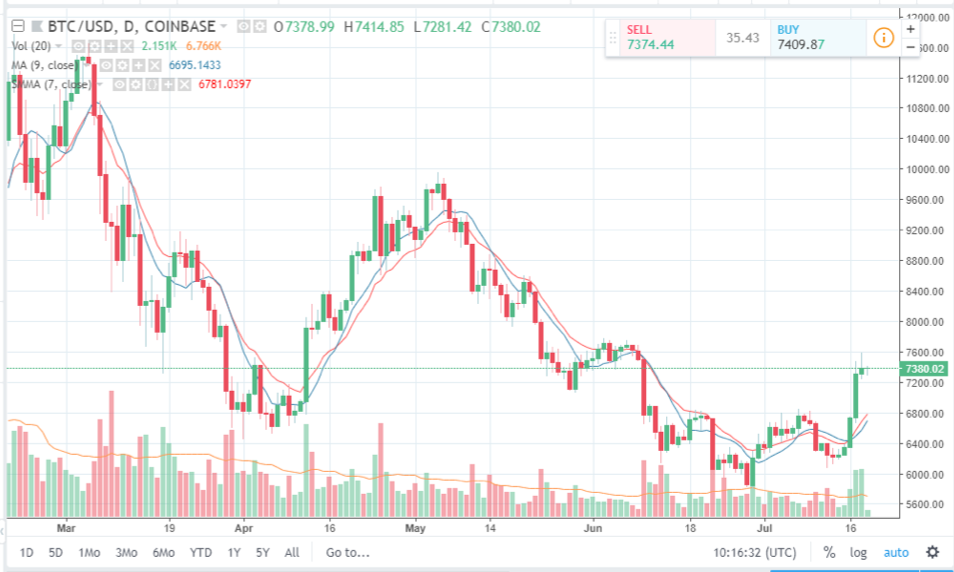
Bitcoin (BTC/USD)
Price Analysis
- High: $7414.85 USD
- Low: $7281.42 USD
- Major Resistance Level: Near $7600
- Hourly MACD: Placed in the Buy region with a positive attitude.
“I think then you will have something that will end up being somewhere around $20,000-$40,000” Marc Lasry, co-founder of Avenue Capital Group on CNBC regarding Bitcoin price.
The BTC/USD pair is currently in the mood of setting a short-term bullish flag pattern where the support slightly above the $7300 level, as can be observed from the chart. Bitcoin (BTC) has been gradually progressing towards the green from 14th July 2018, and the BlackRock news seems to have strengthened it on 16th July when the price surged upwards to a little above $6730 USD.
At the time of writing on 19th July 2018, the price action of the BTC/USD pair shows an uptrend even while it keeps consolidating the position. At the time of writing, as can be seen from the chart, the price of Bitcoin shows $7380.02 USD. The moving average (blue line) marking at 6695.1433 indicates the price, at least for the time being, is most likely to move upward.
Yesterday, the weak support at the $7400 level had failed to gain strength and had thus required lower corrections. This had made the space a little more volatile with the formation of slight bearish trends today some time. The corrections will most likely continue until the price settles strongly above the major resistance line near the $7400 level. Meanwhile, the hourly MACD shows that the crypto coin is placed slightly in the Buy region.
Bitcoin Cash (BCH/USD)
Price Analysis
- High: $831.2 USD
- Low: $803.4 USD
- Major Resistance Level: $900
- Hourly MACD: Placed slightly in the Sell region.

Holding onto the green candles till 17th July 2018 from 13th July 2018, the BCH/USD pair had shown bearish signals yesterday. At the time of writing, however, the price of Bitcoin Cash (BCH) shows $824.9 USD and is sporting a small green candle. As of now, it can be said that the pair is testing the $800 support region.
On 17th July, the Bitcoin Cash price had reached above the $850 resistance against the US dollar. A high had formed neared the $890 level with an eye on the $900 resistance level. The chances of continuing in the upwards direction for the BCH/USD pair depends on how it strengthens on the $800 support line, currently.
The moving average (blue line), at the time of writing, marks at 757.2333. This also indicates that the pressure has bordered on the sellers that have placed the crypto coin slightly in the Sell region. If the position strengths then, it will again create a pressure on the buyers.
Both Bitcoin (BTC) and Bitcoin Cash (BCH) are correcting their positions against the US Dollar at the time of writing and is trying to create a stronger support line.
Happy Trading~
For the latest cryptocurrency news, join our Telegram!
Disclaimer: This article should not be taken as, and is not intended to provide, investment advice. Global Coin Report and/or its affiliates, employees, writers, and subcontractors are cryptocurrency investors and from time to time may or may not have holdings in some of the coins or tokens they cover. Please conduct your own thorough research before investing in any cryptocurrency and read our full disclaimer.
Image courtesy of Pexels
Charts courtesy of tradingview.com
The post Bitcoin, Bitcoin Cash Price Analysis: Pausing for Direction appeared first on Global Coin Report.
Read more at https://globalcoinreport.com/bitcoin-bitcoin-cash-price-analysis-pausing-for-direction/

Globalcoinreport.com/ is author of this content, TheBitcoinNews.com is is not responsible for the content of external sites.
Our Social Networks: Facebook Instagram Pinterest Reddit Telegram Twitter Youtube


